Daily / Monthly Weather History From This Station
Javascript must be enabled to view the 24 Hour Graph images.
April2024.htm
Daily Report for the month of April 2024
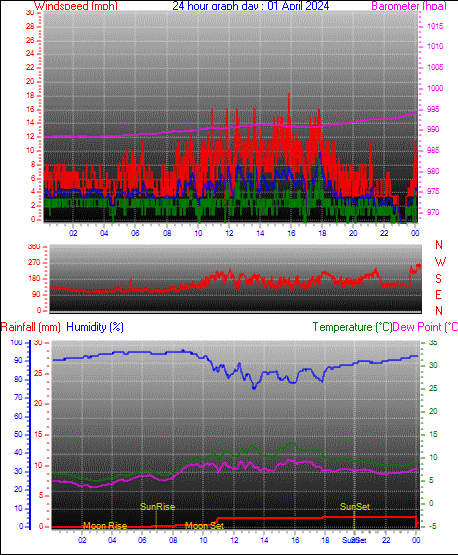
Apr 1 Average and Extremes
Average temperature = 8.8°C
Average humidity = 89%
Average dewpoint = 7.1°C
Average barometer = 990.4 hPa
Average windspeed = 4.5 mph
Average gustspeed = 7.0 mph
Average direction = 155° (SSE)
Rainfall for month = 1.6 mm
Rainfall for year = 376.4 mm
Maximum rain per minute = 0.2 mm on day 01 at time 17:54
Maximum rain per minute = 0.2 mm on day 01 at time 17:54
Maximum temperature = 13.3°C on day 01 at time 15:57
Minimum temperature = 5.0°C on day 01 at time 03:06
Maximum humidity = 96% on day 01 at time 08:43
Minimum humidity = 75% on day 01 at time 13:24
Maximum pressure = 994.3 hPa on day 01 at time 00:00
Minimum pressure = 988.3 hPa on day 01 at time 03:01
Maximum windspeed = 12 mph on day 01 at time 17:49
Maximum gust speed = 18 mph from 206 °(SSW) on day 01 at time 15:51
Maximum heat index = 13.3°C on day 01 at time 15:57
Click here to toggle the 24 Hour Graph of this day
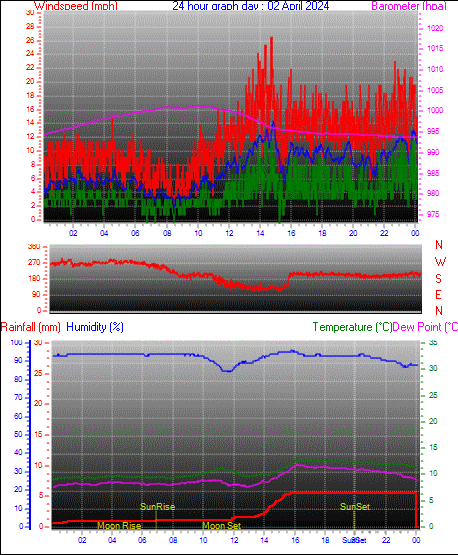
Apr 2 Average and Extremes
Average temperature = 10.7°C
Average humidity = 92%
Average dewpoint = 9.5°C
Average barometer = 997.2 hPa
Average windspeed = 7.5 mph
Average gustspeed = 11.4 mph
Average direction = 206° (SSW)
Rainfall for month = 7.2 mm
Rainfall for year = 382.0 mm
Maximum rain per minute = 0.4 mm on day 02 at time 00:02
Maximum rain per minute = 0.4 mm on day 02 at time 00:02
Maximum temperature = 12.9°C on day 02 at time 16:15
Minimum temperature = 8.9°C on day 02 at time 00:10
Maximum humidity = 96% on day 02 at time 15:56
Minimum humidity = 84% on day 02 at time 11:46
Maximum pressure = 1001.3 hPa on day 02 at time 09:53
Minimum pressure = 993.8 hPa on day 02 at time 23:09
Maximum windspeed = 17 mph on day 02 at time 14:44
Maximum gust speed = 26 mph from 135 °( SE) on day 02 at time 14:47
Maximum heat index = 12.9°C on day 02 at time 16:13
Click here to toggle the 24 Hour Graph of this day
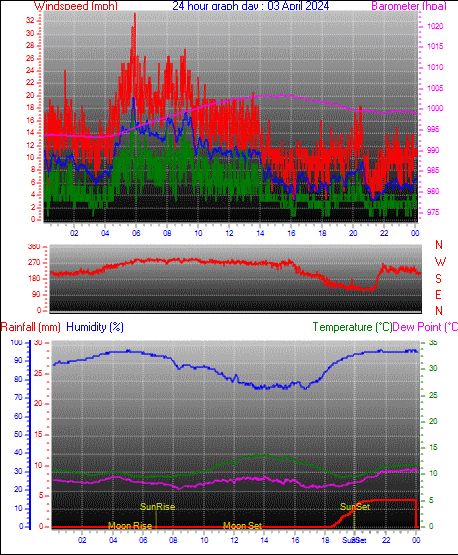
Apr 3 Average and Extremes
Average temperature = 11.0°C
Average humidity = 88%
Average dewpoint = 9.1°C
Average barometer = 999.0 hPa
Average windspeed = 9.4 mph
Average gustspeed = 13.9 mph
Average direction = 256° (WSW)
Rainfall for month = 11.6 mm
Rainfall for year = 386.4 mm
Maximum rain per minute = 0.2 mm on day 03 at time 21:06
Maximum rain per minute = 0.2 mm on day 03 at time 21:06
Maximum temperature = 13.9°C on day 03 at time 14:10
Minimum temperature = 9.4°C on day 03 at time 06:17
Maximum humidity = 96% on day 03 at time 23:58
Minimum humidity = 75% on day 03 at time 16:47
Maximum pressure = 1003.5 hPa on day 03 at time 15:31
Minimum pressure = 993.3 hPa on day 03 at time 03:26
Maximum windspeed = 22 mph on day 03 at time 05:48
Maximum gust speed = 33 mph from 284 °(WNW) on day 03 at time 05:57
Maximum heat index = 13.9°C on day 03 at time 14:10
Click here to toggle the 24 Hour Graph of this day
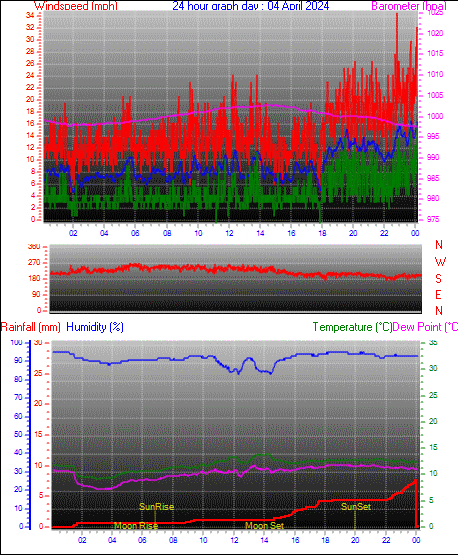
Apr 4 Average and Extremes
Average temperature = 11.8°C
Average humidity = 92%
Average dewpoint = 10.5°C
Average barometer = 1000.1 hPa
Average windspeed = 9.2 mph
Average gustspeed = 14.4 mph
Average direction = 223° ( SW)
Rainfall for month = 19.2 mm
Rainfall for year = 394.0 mm
Maximum rain per minute = 0.2 mm on day 04 at time 23:52
Maximum rain per minute = 0.2 mm on day 04 at time 23:52
Maximum temperature = 13.9°C on day 04 at time 14:17
Minimum temperature = 9.1°C on day 04 at time 03:04
Maximum humidity = 95% on day 04 at time 20:32
Minimum humidity = 83% on day 04 at time 14:29
Maximum pressure = 1002.8 hPa on day 04 at time 14:28
Minimum pressure = 997.6 hPa on day 04 at time 23:42
Maximum windspeed = 22 mph on day 04 at time 23:42
Maximum gust speed = 35 mph from 180 °( S ) on day 04 at time 22:49
Maximum heat index = 13.9°C on day 04 at time 14:17
Click here to toggle the 24 Hour Graph of this day
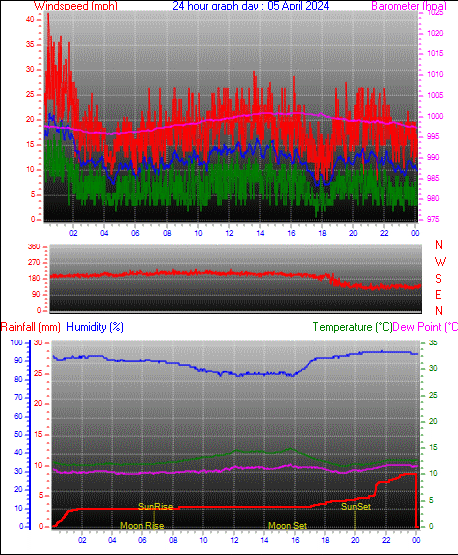
Apr 5 Average and Extremes
Average temperature = 12.8°C
Average humidity = 89%
Average dewpoint = 11.1°C
Average barometer = 998.5 hPa
Average windspeed = 12.5 mph
Average gustspeed = 18.7 mph
Average direction = 196° (SSW)
Rainfall for month = 27.8 mm
Rainfall for year = 402.6 mm
Maximum rain per minute = 0.6 mm on day 05 at time 21:20
Maximum rain per minute = 0.6 mm on day 05 at time 21:20
Maximum temperature = 15.0°C on day 05 at time 15:46
Minimum temperature = 11.6°C on day 05 at time 19:06
Maximum humidity = 96% on day 05 at time 21:44
Minimum humidity = 82% on day 05 at time 15:56
Maximum pressure = 1001.0 hPa on day 05 at time 14:38
Minimum pressure = 995.8 hPa on day 05 at time 04:57
Maximum windspeed = 25 mph on day 04 at time 00:25
Maximum gust speed = 41 mph from 183 °( S ) on day 05 at time 00:25
Maximum heat index = 15.0°C on day 05 at time 15:46
Click here to toggle the 24 Hour Graph of this day
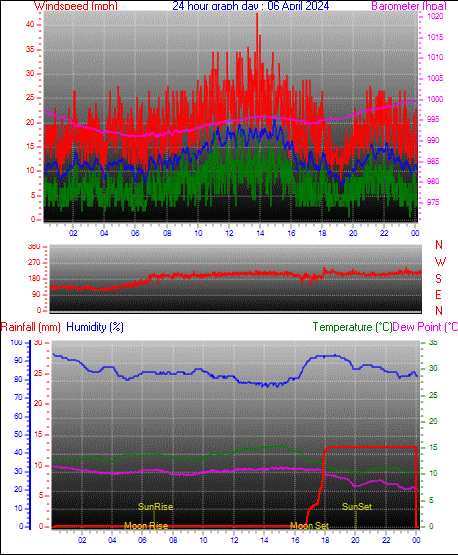
Apr 6 Average and Extremes
Average temperature = 12.9°C
Average humidity = 85%
Average dewpoint = 10.4°C
Average barometer = 994.7 hPa
Average windspeed = 13.0 mph
Average gustspeed = 19.6 mph
Average direction = 192° (SSW)
Rainfall for month = 40.8 mm
Rainfall for year = 415.6 mm
Maximum rain per minute = 1.2 mm on day 06 at time 17:55
Maximum rain per minute = 1.2 mm on day 06 at time 17:55
Maximum temperature = 15.5°C on day 06 at time 15:09
Minimum temperature = 10.3°C on day 06 at time 20:05
Maximum humidity = 94% on day 06 at time 18:38
Minimum humidity = 76% on day 06 at time 14:53
Maximum pressure = 999.7 hPa on day 06 at time 23:56
Minimum pressure = 990.9 hPa on day 06 at time 07:21
Maximum windspeed = 25 mph on day 06 at time 11:55
Maximum gust speed = 43 mph from 230 °( SW) on day 06 at time 13:51
Maximum heat index = 15.5°C on day 06 at time 14:48
Click here to toggle the 24 Hour Graph of this day
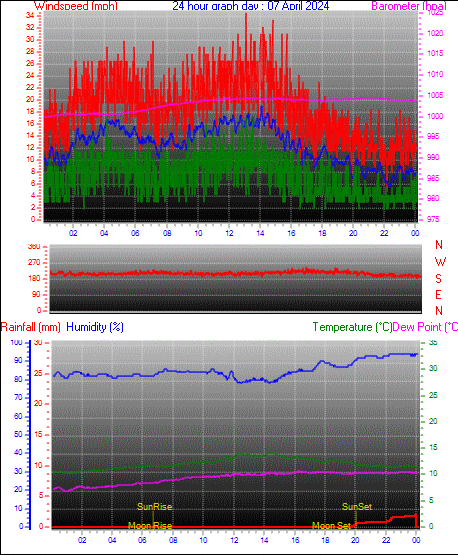
Apr 7 Average and Extremes
Average temperature = 12.1°C
Average humidity = 85%
Average dewpoint = 9.6°C
Average barometer = 1003.0 hPa
Average windspeed = 12.7 mph
Average gustspeed = 18.5 mph
Average direction = 212° (SSW)
Rainfall for month = 42.8 mm
Rainfall for year = 417.6 mm
Maximum rain per minute = 0.2 mm on day 07 at time 22:27
Maximum rain per minute = 0.2 mm on day 07 at time 22:27
Maximum temperature = 14.2°C on day 07 at time 14:28
Minimum temperature = 10.2°C on day 07 at time 01:26
Maximum humidity = 94% on day 07 at time 23:59
Minimum humidity = 78% on day 07 at time 14:22
Maximum pressure = 1004.5 hPa on day 07 at time 21:07
Minimum pressure = 999.7 hPa on day 07 at time 00:01
Maximum windspeed = 23 mph on day 07 at time 14:03
Maximum gust speed = 35 mph from 210 °(SSW) on day 07 at time 13:07
Maximum heat index = 14.2°C on day 07 at time 14:26
Click here to toggle the 24 Hour Graph of this day
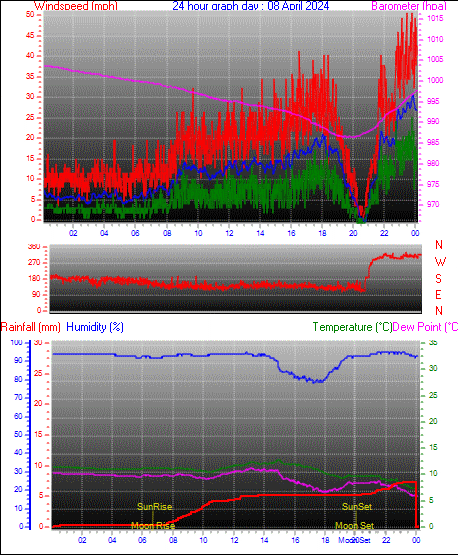
Apr 8 Average and Extremes
Average temperature = 10.8°C
Average humidity = 92%
Average dewpoint = 9.5°C
Average barometer = 995.6 hPa
Average windspeed = 11.7 mph
Average gustspeed = 18.3 mph
Average direction = 159° (SSE)
Rainfall for month = 50.2 mm
Rainfall for year = 425.0 mm
Maximum rain per minute = 0.2 mm on day 08 at time 23:06
Maximum rain per minute = 0.2 mm on day 08 at time 23:06
Maximum temperature = 12.8°C on day 08 at time 14:56
Minimum temperature = 7.4°C on day 08 at time 23:59
Maximum humidity = 95% on day 08 at time 23:14
Minimum humidity = 78% on day 08 at time 17:16
Maximum pressure = 1003.8 hPa on day 08 at time 00:01
Minimum pressure = 986.4 hPa on day 08 at time 19:55
Maximum windspeed = 33 mph on day 08 at time 23:47
Maximum gust speed = 51 mph from 325 °( NW) on day 08 at time 23:47
Maximum heat index = 12.8°C on day 08 at time 14:56
Click here to toggle the 24 Hour Graph of this day
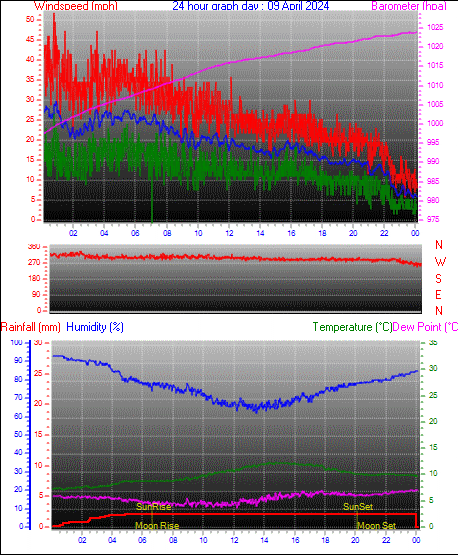
Apr 9 Average and Extremes
Average temperature = 9.8°C
Average humidity = 77%
Average dewpoint = 5.9°C
Average barometer = 1013.8 hPa
Average windspeed = 19.3 mph
Average gustspeed = 26.7 mph
Average direction = 300° (WNW)
Rainfall for month = 52.4 mm
Rainfall for year = 427.2 mm
Maximum rain per minute = 0.2 mm on day 09 at time 04:53
Maximum rain per minute = 0.2 mm on day 09 at time 04:53
Maximum temperature = 12.3°C on day 09 at time 14:45
Minimum temperature = 7.1°C on day 09 at time 00:49
Maximum humidity = 93% on day 09 at time 00:51
Minimum humidity = 62% on day 09 at time 13:30
Maximum pressure = 1023.8 hPa on day 09 at time 23:37
Minimum pressure = 997.4 hPa on day 09 at time 00:01
Maximum windspeed = 37 mph on day 08 at time 00:46
Maximum gust speed = 52 mph from 285 °(WNW) on day 09 at time 00:45
Maximum heat index = 12.3°C on day 09 at time 14:45
Click here to toggle the 24 Hour Graph of this day
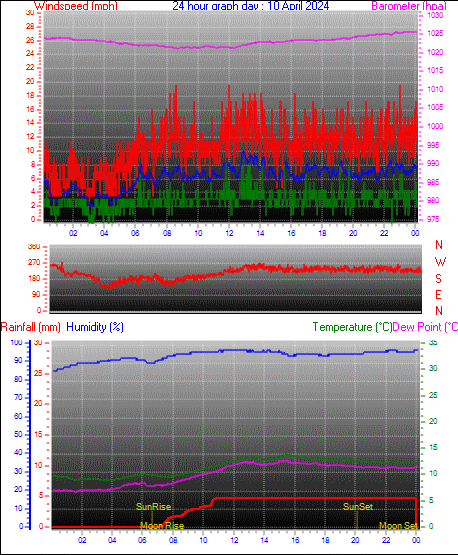
Apr 10 Average and Extremes
Average temperature = 11.4°C
Average humidity = 93%
Average dewpoint = 10.3°C
Average barometer = 1023.1 hPa
Average windspeed = 6.4 mph
Average gustspeed = 10.5 mph
Average direction = 219° ( SW)
Rainfall for month = 57.2 mm
Rainfall for year = 432.0 mm
Maximum rain per minute = 0.4 mm on day 10 at time 10:34
Maximum rain per minute = 0.4 mm on day 10 at time 10:34
Maximum temperature = 13.8°C on day 10 at time 15:32
Minimum temperature = 8.8°C on day 10 at time 01:42
Maximum humidity = 96% on day 10 at time 23:59
Minimum humidity = 85% on day 10 at time 00:23
Maximum pressure = 1025.7 hPa on day 10 at time 23:48
Minimum pressure = 1021.1 hPa on day 10 at time 08:44
Maximum windspeed = 13 mph on day 10 at time 13:42
Maximum gust speed = 20 mph from 292 °(WNW) on day 10 at time 23:01
Maximum heat index = 13.8°C on day 10 at time 15:31
Click here to toggle the 24 Hour Graph of this day
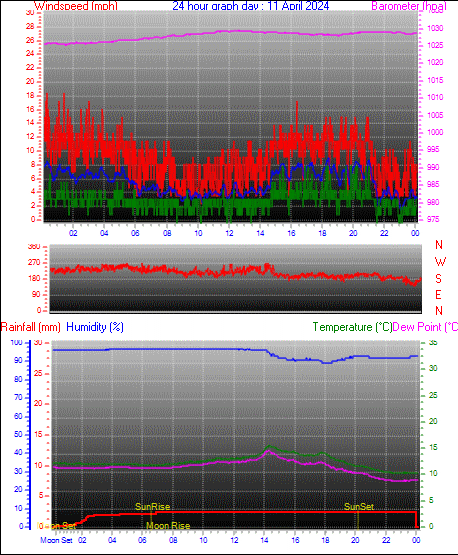
Apr 11 Average and Extremes
Average temperature = 12.4°C
Average humidity = 95%
Average dewpoint = 11.6°C
Average barometer = 1027.9 hPa
Average windspeed = 5.7 mph
Average gustspeed = 9.1 mph
Average direction = 216° ( SW)
Rainfall for month = 59.6 mm
Rainfall for year = 434.4 mm
Maximum rain per minute = 0.2 mm on day 11 at time 04:30
Maximum rain per minute = 0.2 mm on day 11 at time 04:30
Maximum temperature = 15.6°C on day 11 at time 14:21
Minimum temperature = 10.2°C on day 11 at time 22:52
Maximum humidity = 97% on day 11 at time 13:06
Minimum humidity = 89% on day 11 at time 18:27
Maximum pressure = 1029.5 hPa on day 11 at time 12:26
Minimum pressure = 1025.4 hPa on day 11 at time 01:34
Maximum windspeed = 10 mph on day 11 at time 21:01
Maximum gust speed = 18 mph from 220 °( SW) on day 11 at time 01:25
Maximum heat index = 15.5°C on day 11 at time 14:21
Click here to toggle the 24 Hour Graph of this day
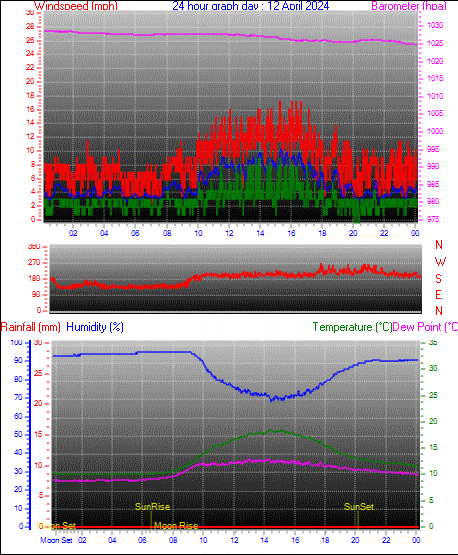
Apr 12 Average and Extremes
Average temperature = 13.3°C
Average humidity = 86%
Average dewpoint = 10.9°C
Average barometer = 1027.1 hPa
Average windspeed = 5.5 mph
Average gustspeed = 8.5 mph
Average direction = 190° ( S )
Rainfall for month = 59.6 mm
Rainfall for year = 434.4 mm
Maximum rain per minute = 0.0 mm on day 12 at time 23:59
Maximum rain per minute = 0.0 mm on day 12 at time 23:59
Maximum temperature = 18.5°C on day 12 at time 15:11
Minimum temperature = 9.9°C on day 12 at time 02:15
Maximum humidity = 95% on day 12 at time 09:13
Minimum humidity = 68% on day 12 at time 14:27
Maximum pressure = 1028.8 hPa on day 12 at time 00:40
Minimum pressure = 1024.9 hPa on day 12 at time 23:59
Maximum windspeed = 13 mph on day 12 at time 15:20
Maximum gust speed = 17 mph from 197 °(SSW) on day 12 at time 16:39
Maximum heat index = 18.5°C on day 12 at time 14:25
Click here to toggle the 24 Hour Graph of this day
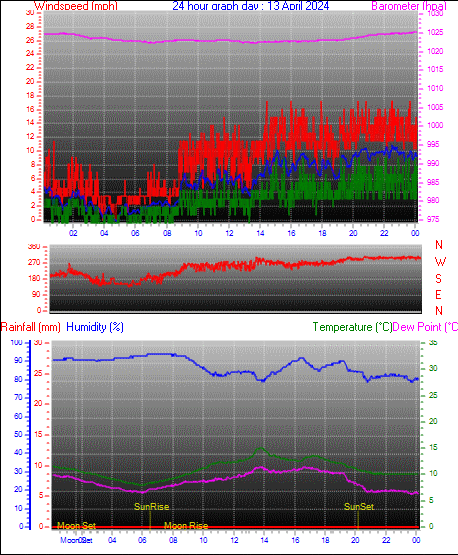
Apr 13 Average and Extremes
Average temperature = 11.1°C
Average humidity = 88%
Average dewpoint = 9.1°C
Average barometer = 1023.4 hPa
Average windspeed = 5.9 mph
Average gustspeed = 8.8 mph
Average direction = 269° ( W )
Rainfall for month = 59.6 mm
Rainfall for year = 434.4 mm
Maximum rain per minute = 0.0 mm on day 13 at time 23:59
Maximum rain per minute = 0.0 mm on day 13 at time 23:59
Maximum temperature = 15.1°C on day 13 at time 13:50
Minimum temperature = 7.9°C on day 13 at time 06:04
Maximum humidity = 94% on day 13 at time 08:12
Minimum humidity = 79% on day 13 at time 23:48
Maximum pressure = 1025.3 hPa on day 13 at time 23:54
Minimum pressure = 1022.3 hPa on day 13 at time 07:09
Maximum windspeed = 13 mph on day 13 at time 22:32
Maximum gust speed = 17 mph from 314 °( NW) on day 13 at time 23:40
Maximum heat index = 15.1°C on day 13 at time 13:49
Click here to toggle the 24 Hour Graph of this day
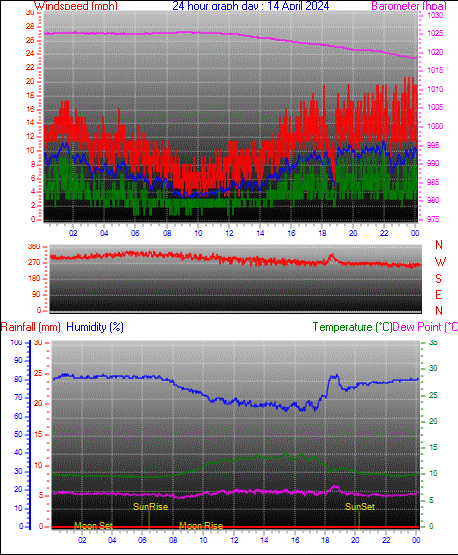
Apr 14 Average and Extremes
Average temperature = 11.0°C
Average humidity = 75%
Average dewpoint = 6.7°C
Average barometer = 1023.7 hPa
Average windspeed = 7.4 mph
Average gustspeed = 11.0 mph
Average direction = 289° (WNW)
Rainfall for month = 59.6 mm
Rainfall for year = 434.4 mm
Maximum rain per minute = 0.0 mm on day 14 at time 23:59
Maximum rain per minute = 0.0 mm on day 14 at time 23:59
Maximum temperature = 14.1°C on day 14 at time 15:27
Minimum temperature = 9.4°C on day 14 at time 07:03
Maximum humidity = 83% on day 14 at time 18:48
Minimum humidity = 63% on day 14 at time 17:19
Maximum pressure = 1025.7 hPa on day 14 at time 08:50
Minimum pressure = 1018.6 hPa on day 14 at time 23:59
Maximum windspeed = 14 mph on day 14 at time 21:54
Maximum gust speed = 21 mph from 264 °( W ) on day 14 at time 23:51
Maximum heat index = 14.1°C on day 14 at time 15:27
Click here to toggle the 24 Hour Graph of this day
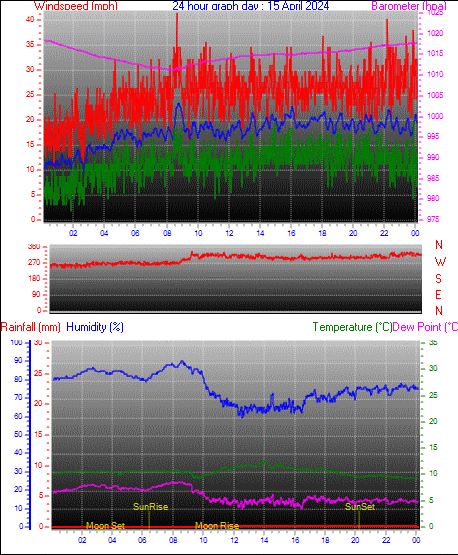
Apr 15 Average and Extremes
Average temperature = 10.5°C
Average humidity = 76%
Average dewpoint = 6.4°C
Average barometer = 1014.9 hPa
Average windspeed = 17.6 mph
Average gustspeed = 24.9 mph
Average direction = 294° (WNW)
Rainfall for month = 59.8 mm
Rainfall for year = 434.6 mm
Maximum rain per minute = 0.2 mm on day 15 at time 09:45
Maximum rain per minute = 0.2 mm on day 15 at time 09:45
Maximum temperature = 12.6°C on day 15 at time 14:07
Minimum temperature = 9.3°C on day 15 at time 23:59
Maximum humidity = 90% on day 15 at time 08:39
Minimum humidity = 59% on day 15 at time 12:34
Maximum pressure = 1018.6 hPa on day 15 at time 00:01
Minimum pressure = 1011.2 hPa on day 15 at time 08:22
Maximum windspeed = 25 mph on day 15 at time 22:15
Maximum gust speed = 41 mph from 324 °( NW) on day 15 at time 08:39
Maximum heat index = 12.6°C on day 15 at time 14:04
Click here to toggle the 24 Hour Graph of this day
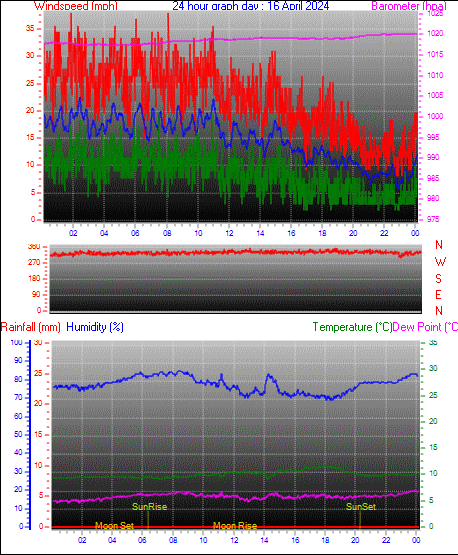
Apr 16 Average and Extremes
Average temperature = 10.0°C
Average humidity = 77%
Average dewpoint = 6.2°C
Average barometer = 1018.6 hPa
Average windspeed = 14.9 mph
Average gustspeed = 22.2 mph
Average direction = 329° (NNW)
Rainfall for month = 59.8 mm
Rainfall for year = 434.6 mm
Maximum rain per minute = 0.0 mm on day 16 at time 23:59
Maximum rain per minute = 0.0 mm on day 16 at time 23:59
Maximum temperature = 11.6°C on day 16 at time 17:58
Minimum temperature = 9.1°C on day 16 at time 07:13
Maximum humidity = 85% on day 16 at time 08:33
Minimum humidity = 69% on day 16 at time 18:33
Maximum pressure = 1020.2 hPa on day 16 at time 23:12
Minimum pressure = 1017.3 hPa on day 16 at time 04:23
Maximum windspeed = 25 mph on day 16 at time 07:31
Maximum gust speed = 38 mph from 320 °( NW) on day 16 at time 08:07
Maximum heat index = 11.6°C on day 16 at time 17:40
Click here to toggle the 24 Hour Graph of this day
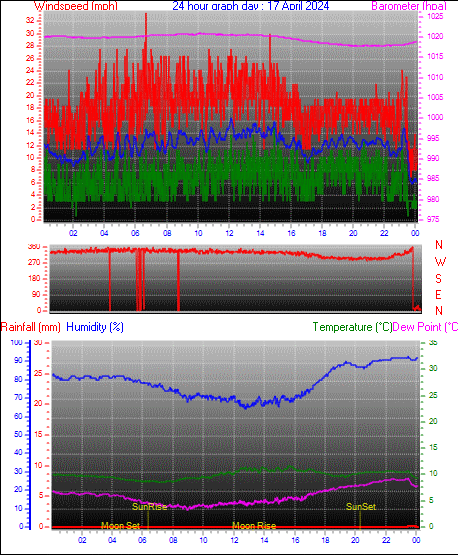
Apr 17 Average and Extremes
Average temperature = 10.0°C
Average humidity = 78%
Average dewpoint = 6.3°C
Average barometer = 1019.7 hPa
Average windspeed = 12.3 mph
Average gustspeed = 18.4 mph
Average direction = 328° (NNW)
Rainfall for month = 60.0 mm
Rainfall for year = 434.8 mm
Maximum rain per minute = 0.2 mm on day 17 at time 23:26
Maximum rain per minute = 0.2 mm on day 17 at time 23:26
Maximum temperature = 11.6°C on day 17 at time 15:44
Minimum temperature = 8.4°C on day 17 at time 07:17
Maximum humidity = 93% on day 17 at time 23:29
Minimum humidity = 64% on day 17 at time 12:49
Maximum pressure = 1020.9 hPa on day 17 at time 10:12
Minimum pressure = 1017.8 hPa on day 17 at time 20:21
Maximum windspeed = 18 mph on day 17 at time 14:22
Maximum gust speed = 33 mph from 337 °(NNW) on day 17 at time 06:40
Maximum heat index = 11.6°C on day 17 at time 15:39
Click here to toggle the 24 Hour Graph of this day
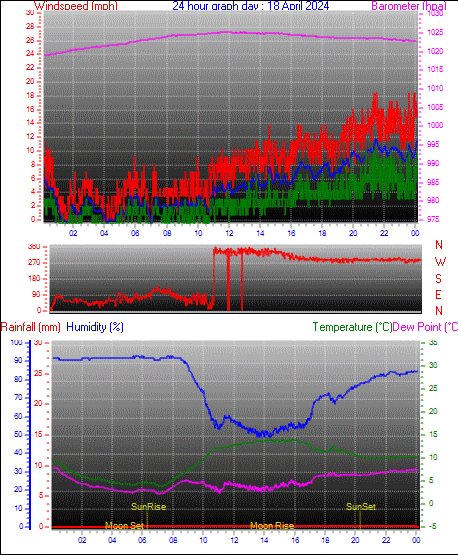
Apr 18 Average and Extremes
Average temperature = 9.4°C
Average humidity = 76%
Average dewpoint = 5.1°C
Average barometer = 1023.3 hPa
Average windspeed = 5.1 mph
Average gustspeed = 7.7 mph
Average direction = 314° ( NW)
Rainfall for month = 60.2 mm
Rainfall for year = 435.0 mm
Maximum rain per minute = 0.2 mm on day 18 at time 05:29
Maximum rain per minute = 0.2 mm on day 18 at time 05:29
Maximum temperature = 14.2°C on day 18 at time 15:51
Minimum temperature = 3.9°C on day 18 at time 07:15
Maximum humidity = 93% on day 18 at time 08:02
Minimum humidity = 49% on day 18 at time 14:29
Maximum pressure = 1025.3 hPa on day 18 at time 11:49
Minimum pressure = 1018.8 hPa on day 18 at time 00:02
Maximum windspeed = 14 mph on day 18 at time 21:27
Maximum gust speed = 18 mph from 243 °(WSW) on day 18 at time 23:58
Maximum heat index = 14.2°C on day 18 at time 15:50
Click here to toggle the 24 Hour Graph of this day
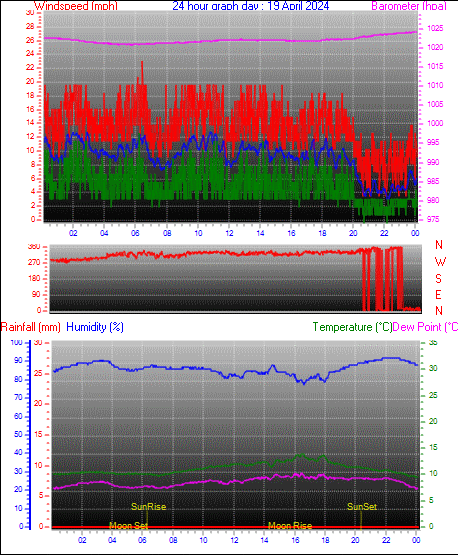
Apr 19 Average and Extremes
Average temperature = 11.2°C
Average humidity = 86%
Average dewpoint = 8.9°C
Average barometer = 1022.0 hPa
Average windspeed = 9.3 mph
Average gustspeed = 13.5 mph
Average direction = 321° ( NW)
Rainfall for month = 60.2 mm
Rainfall for year = 435.0 mm
Maximum rain per minute = 0.0 mm on day 19 at time 23:59
Maximum rain per minute = 0.0 mm on day 19 at time 23:59
Maximum temperature = 13.9°C on day 19 at time 16:35
Minimum temperature = 9.5°C on day 19 at time 23:59
Maximum humidity = 92% on day 19 at time 22:55
Minimum humidity = 77% on day 19 at time 16:38
Maximum pressure = 1024.1 hPa on day 19 at time 23:54
Minimum pressure = 1020.8 hPa on day 19 at time 05:49
Maximum windspeed = 15 mph on day 19 at time 14:14
Maximum gust speed = 23 mph from 339 °(NNW) on day 19 at time 06:27
Maximum heat index = 13.9°C on day 19 at time 16:35
Click here to toggle the 24 Hour Graph of this day
Average and Extremes for Month of April 2024 up to day 19
Average temperature = 11.1°C
Average humidity = 85%
Average dewpoint = 8.6°C
Average barometer = 1011.4 hPa
Average windspeed = 10.0 mph
Average gustspeed = 14.9 mph
Average direction = 261° ( W )
Rainfall for month = 60.4 mm
Rainfall for year = 435.2 mm
Maximum rain per minute = 1.2 mm on day 06 at time 17:55
Maximum rain per minute = 1.2 mm on day 06 at time 17:55
Maximum temperature = 18.5°C on day 12 at time 15:11
Minimum temperature = 3.9°C on day 18 at time 07:15
Maximum humidity = 97% on day 11 at time 13:06
Minimum humidity = 49% on day 18 at time 14:29
Maximum pressure = 1029.5 hPa on day 11 at time 12:26
Minimum pressure = 986.4 hPa on day 08 at time 19:55
Maximum windspeed = 37 mph from 285°(WNW) on day 09 at time 00:45
Maximum gust speed = 52 mph from 315°( NW) on day 09 at time 00:44
Maximum heat index = 18.5°C on day 12 at time 14:25
Growing degrees days :38.6 GDD
Corn growing degrees days :0.0 GDD
Sunshine Hours, ET, Max Solar
Sunshine hours month to date 41:18 hrs
Sunshine hours month to date 41:18 hrs
Sunshine hours year to date 203:59 hrs
Daily Rain Totals
01.6 mm on day 1
05.6 mm on day 2
04.4 mm on day 3
07.6 mm on day 4
08.6 mm on day 5
13.0 mm on day 6
02.0 mm on day 7
07.4 mm on day 8
02.2 mm on day 9
04.8 mm on day 10
02.4 mm on day 11
00.2 mm on day 15
00.2 mm on day 17
00.2 mm on day 18


 Feed
Feed Scan with QR Code Reader
 mobi
mobi


