Climate Warming Stripe - graphics
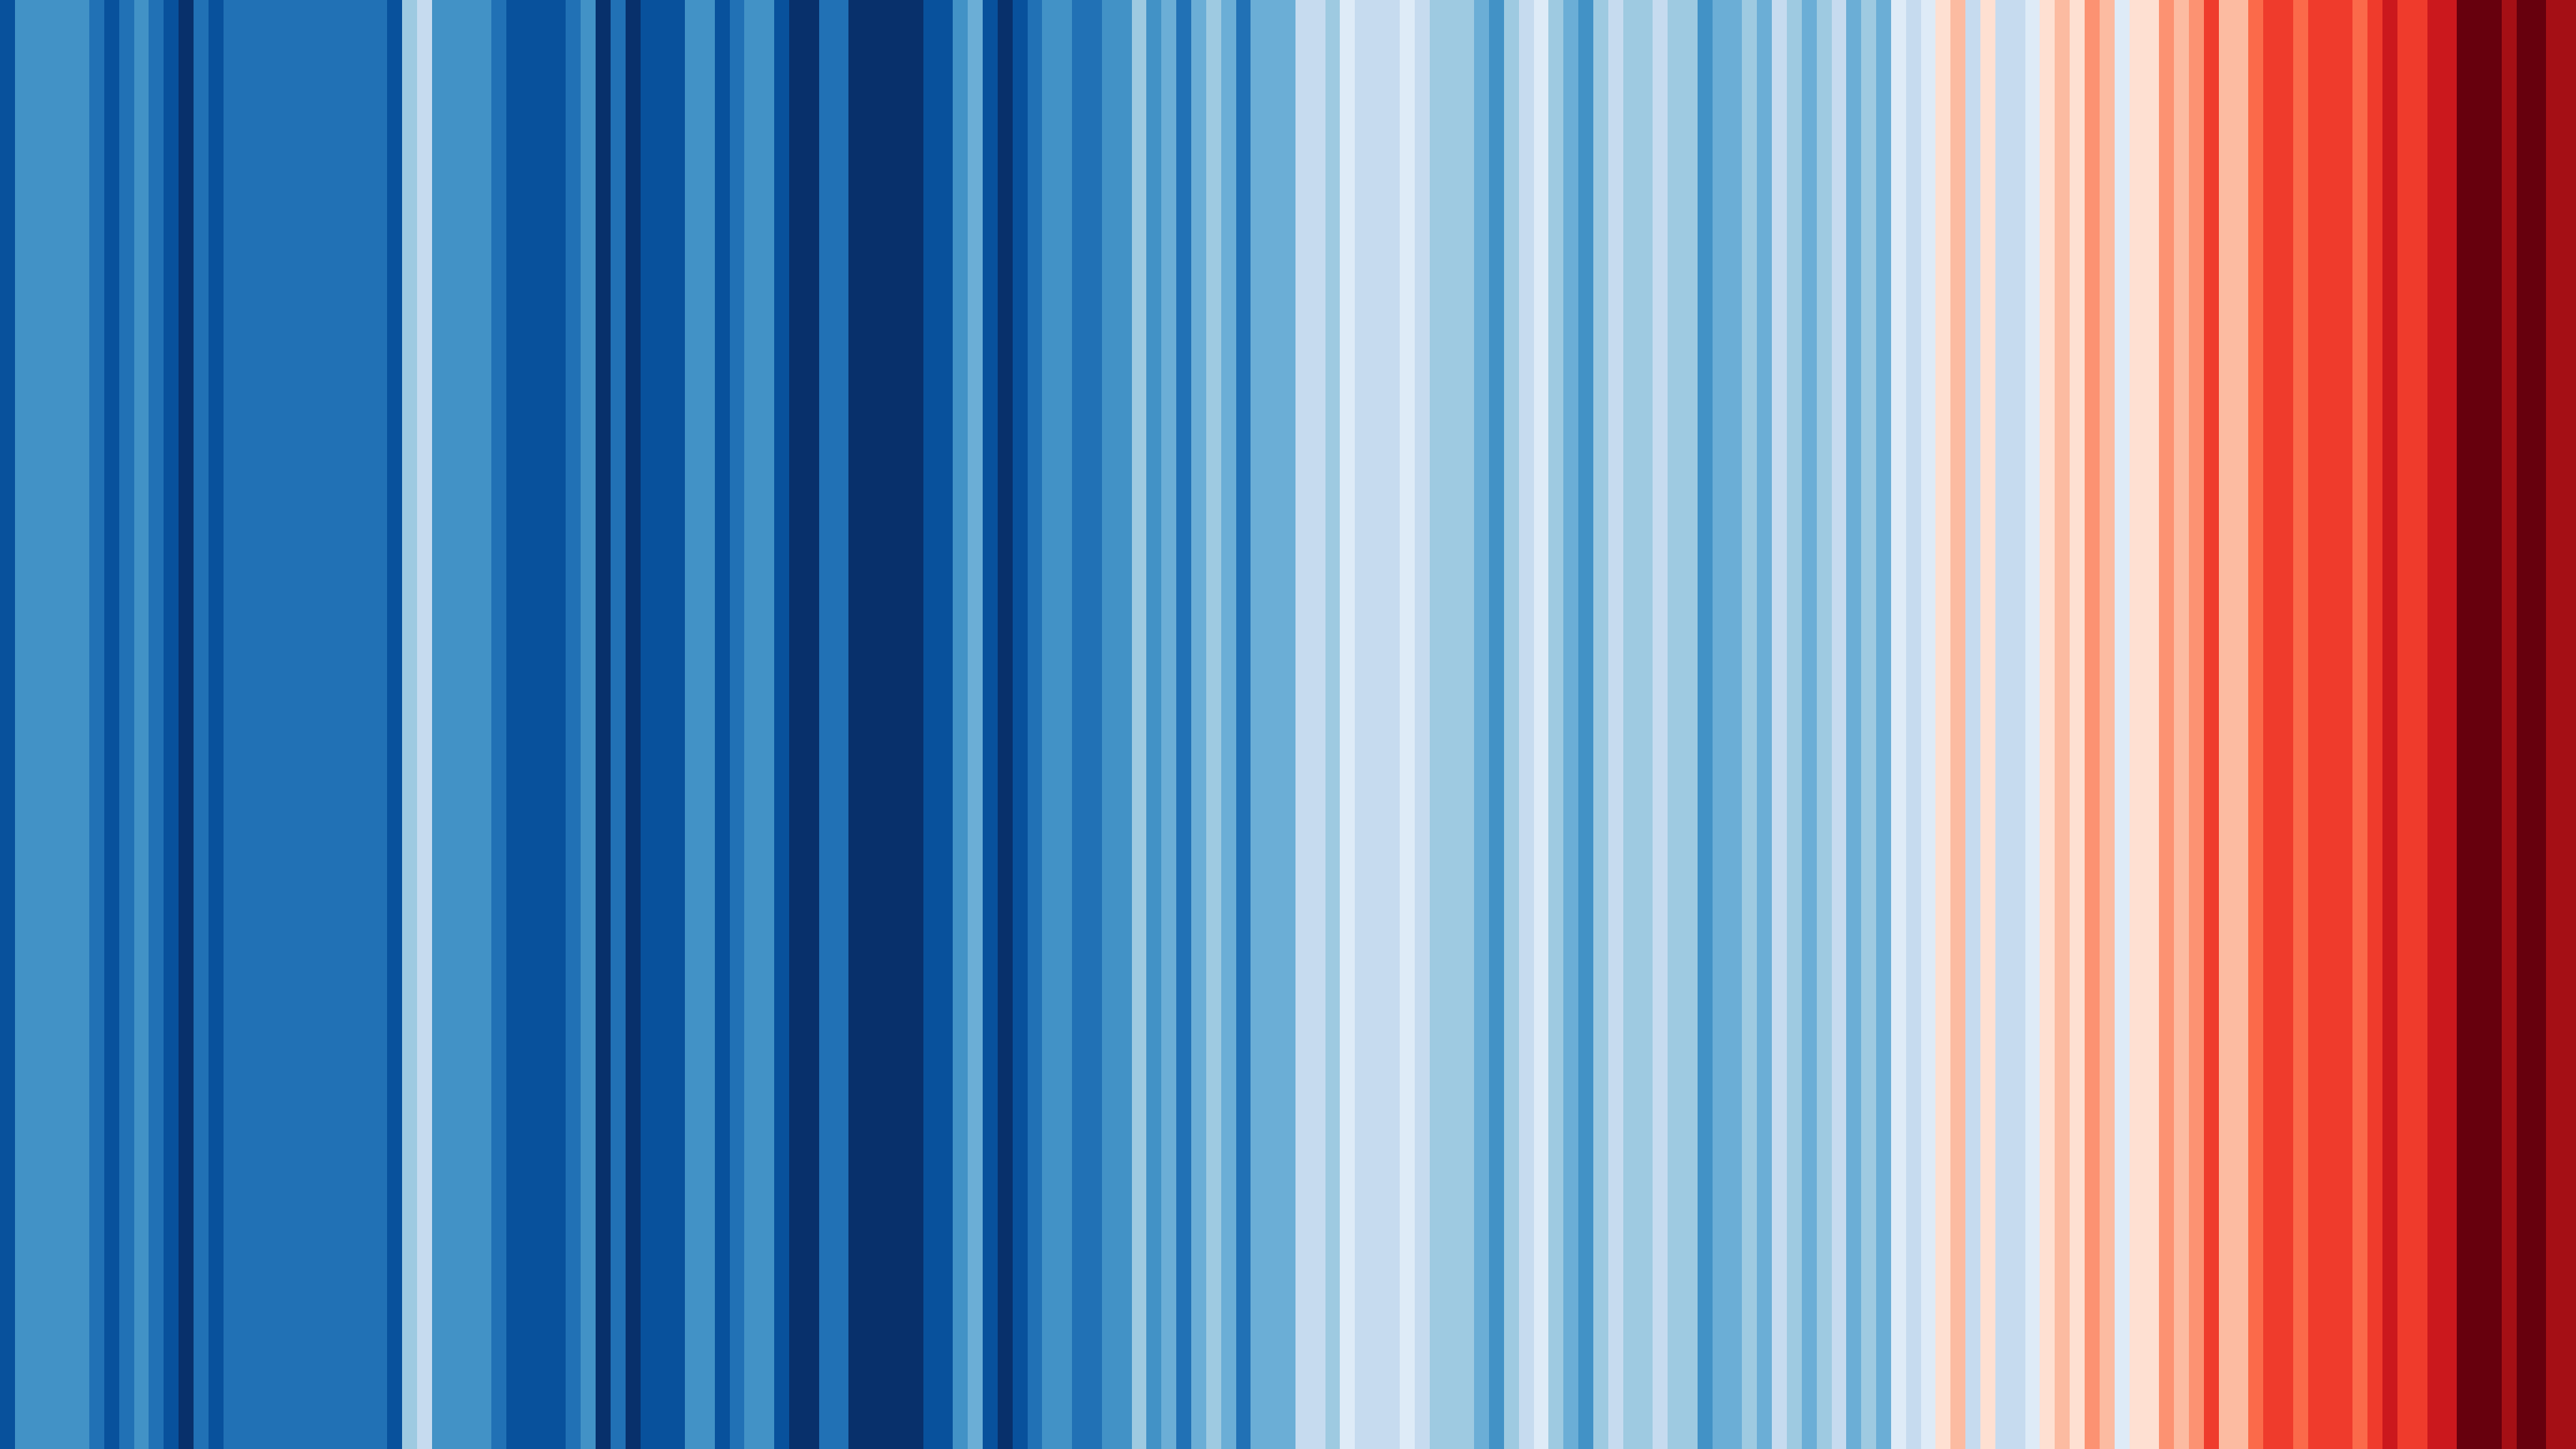
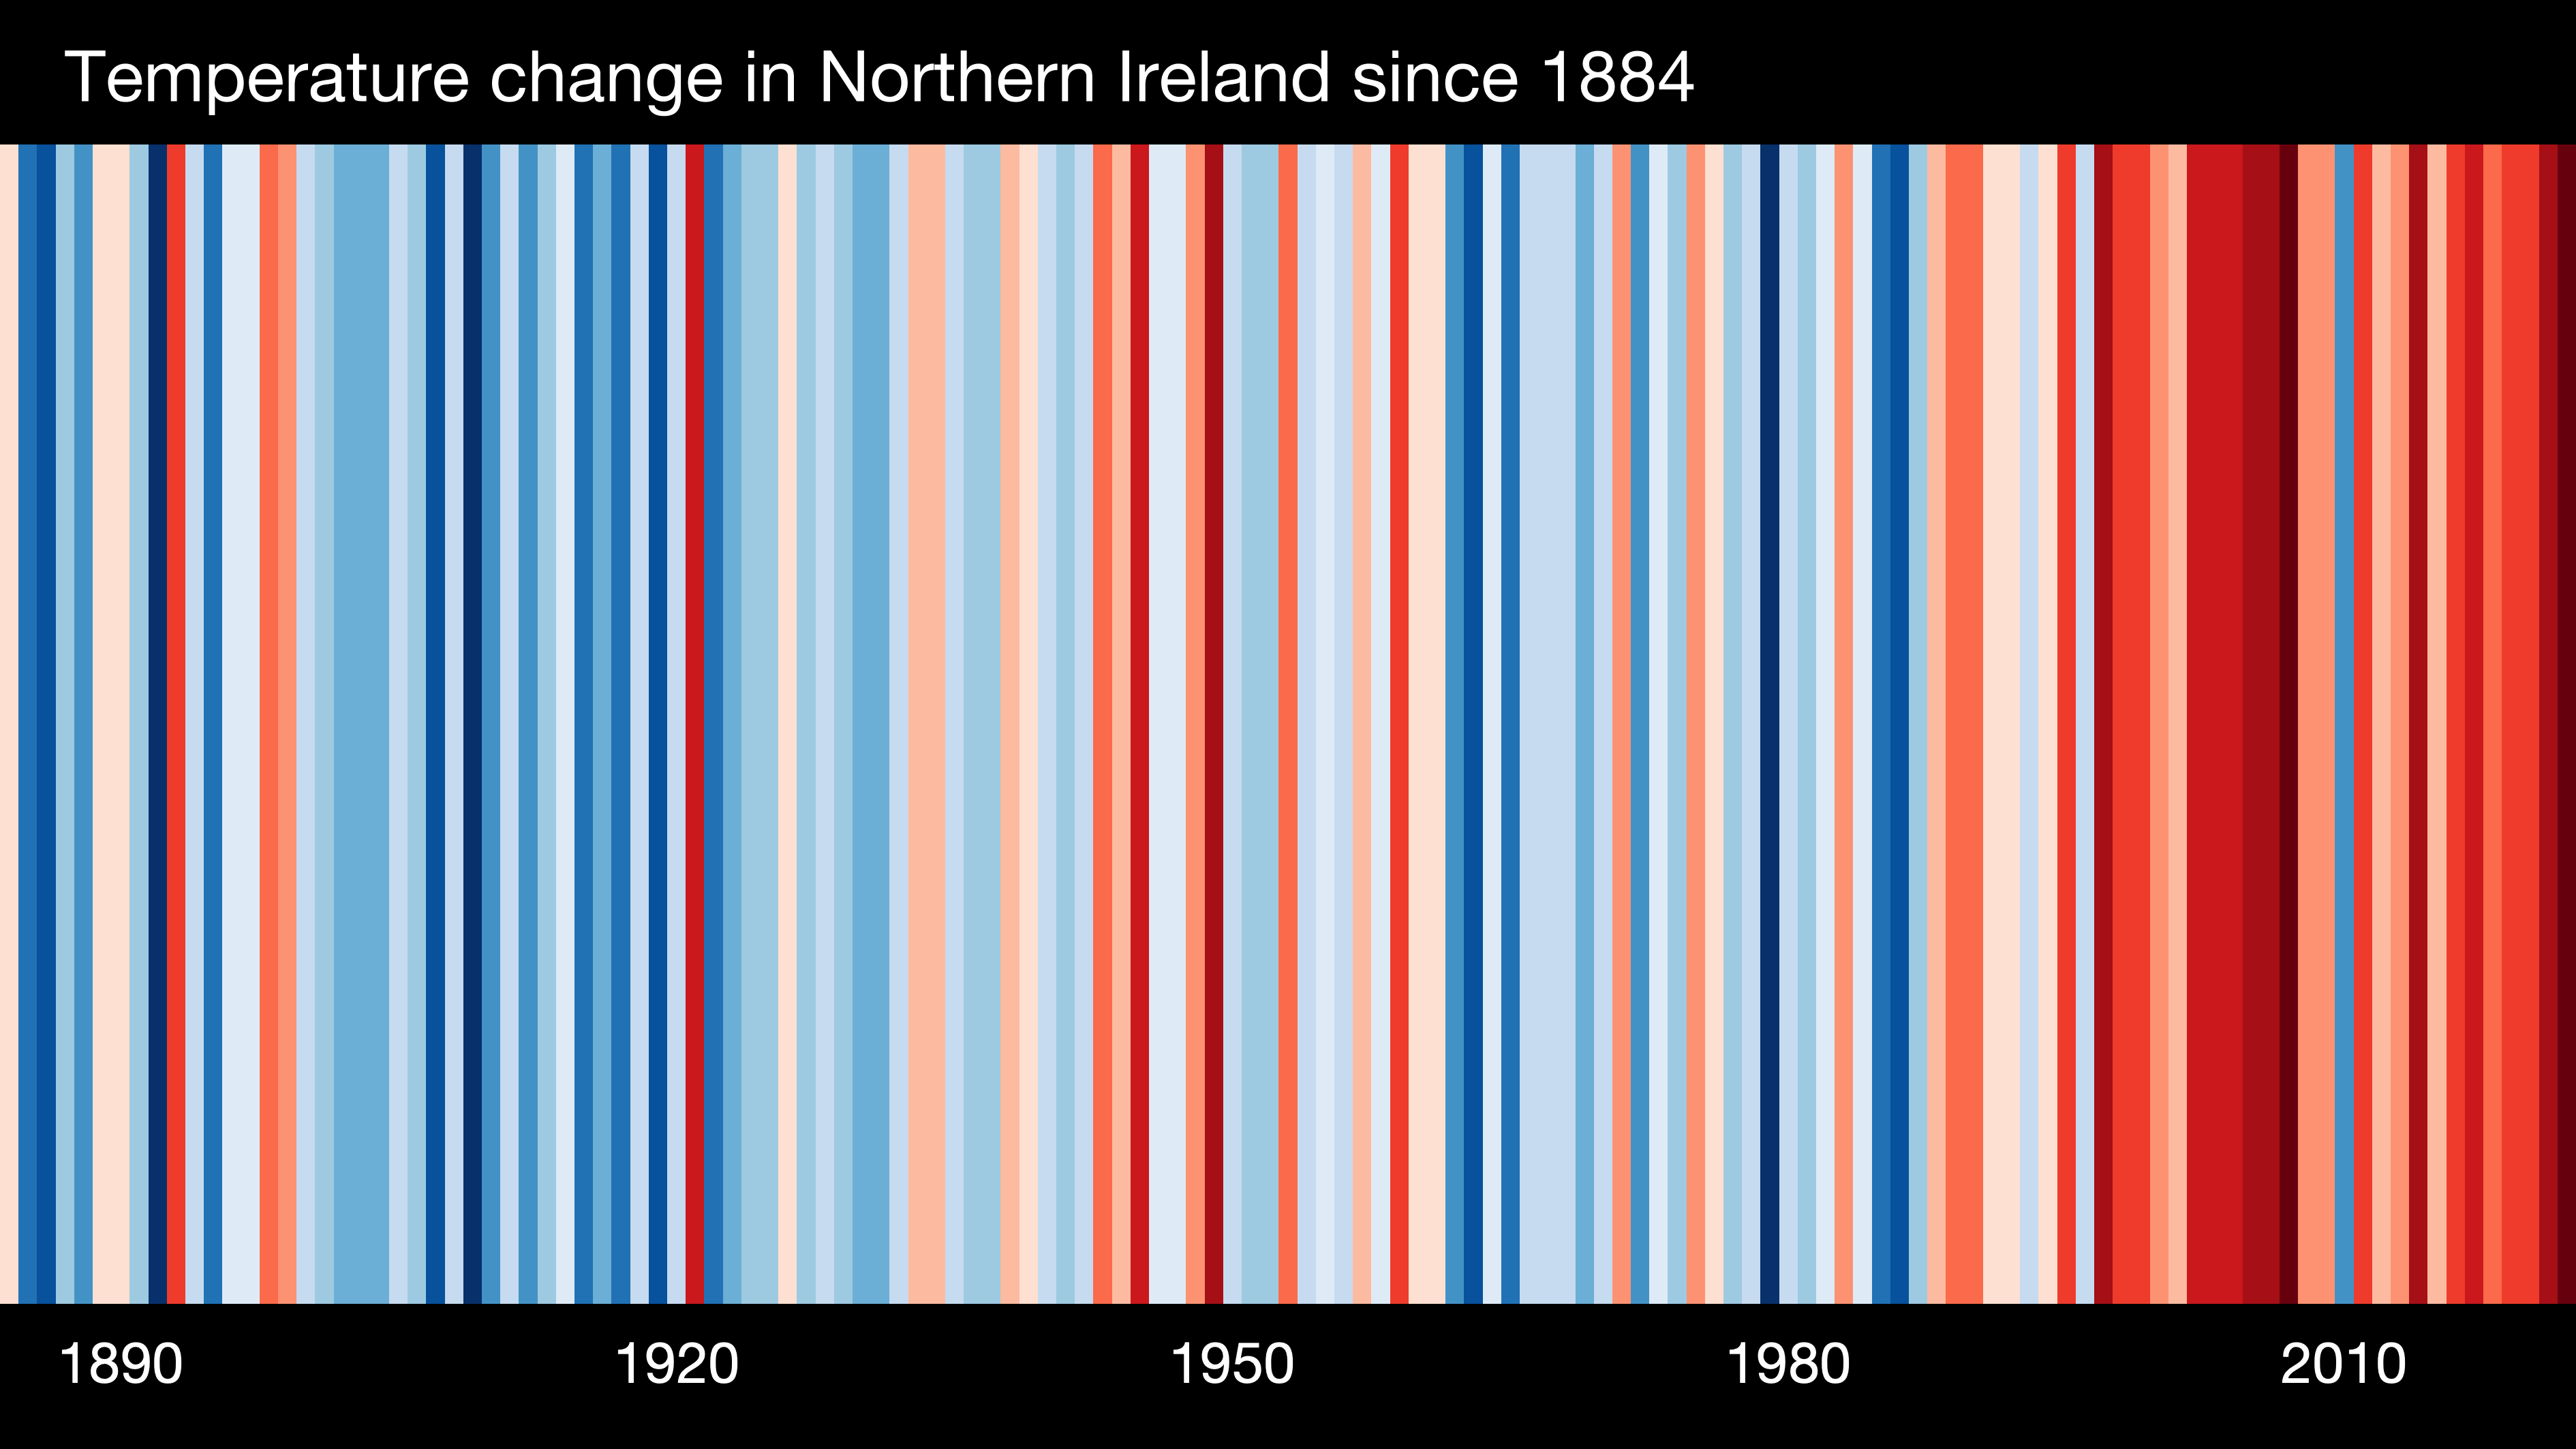
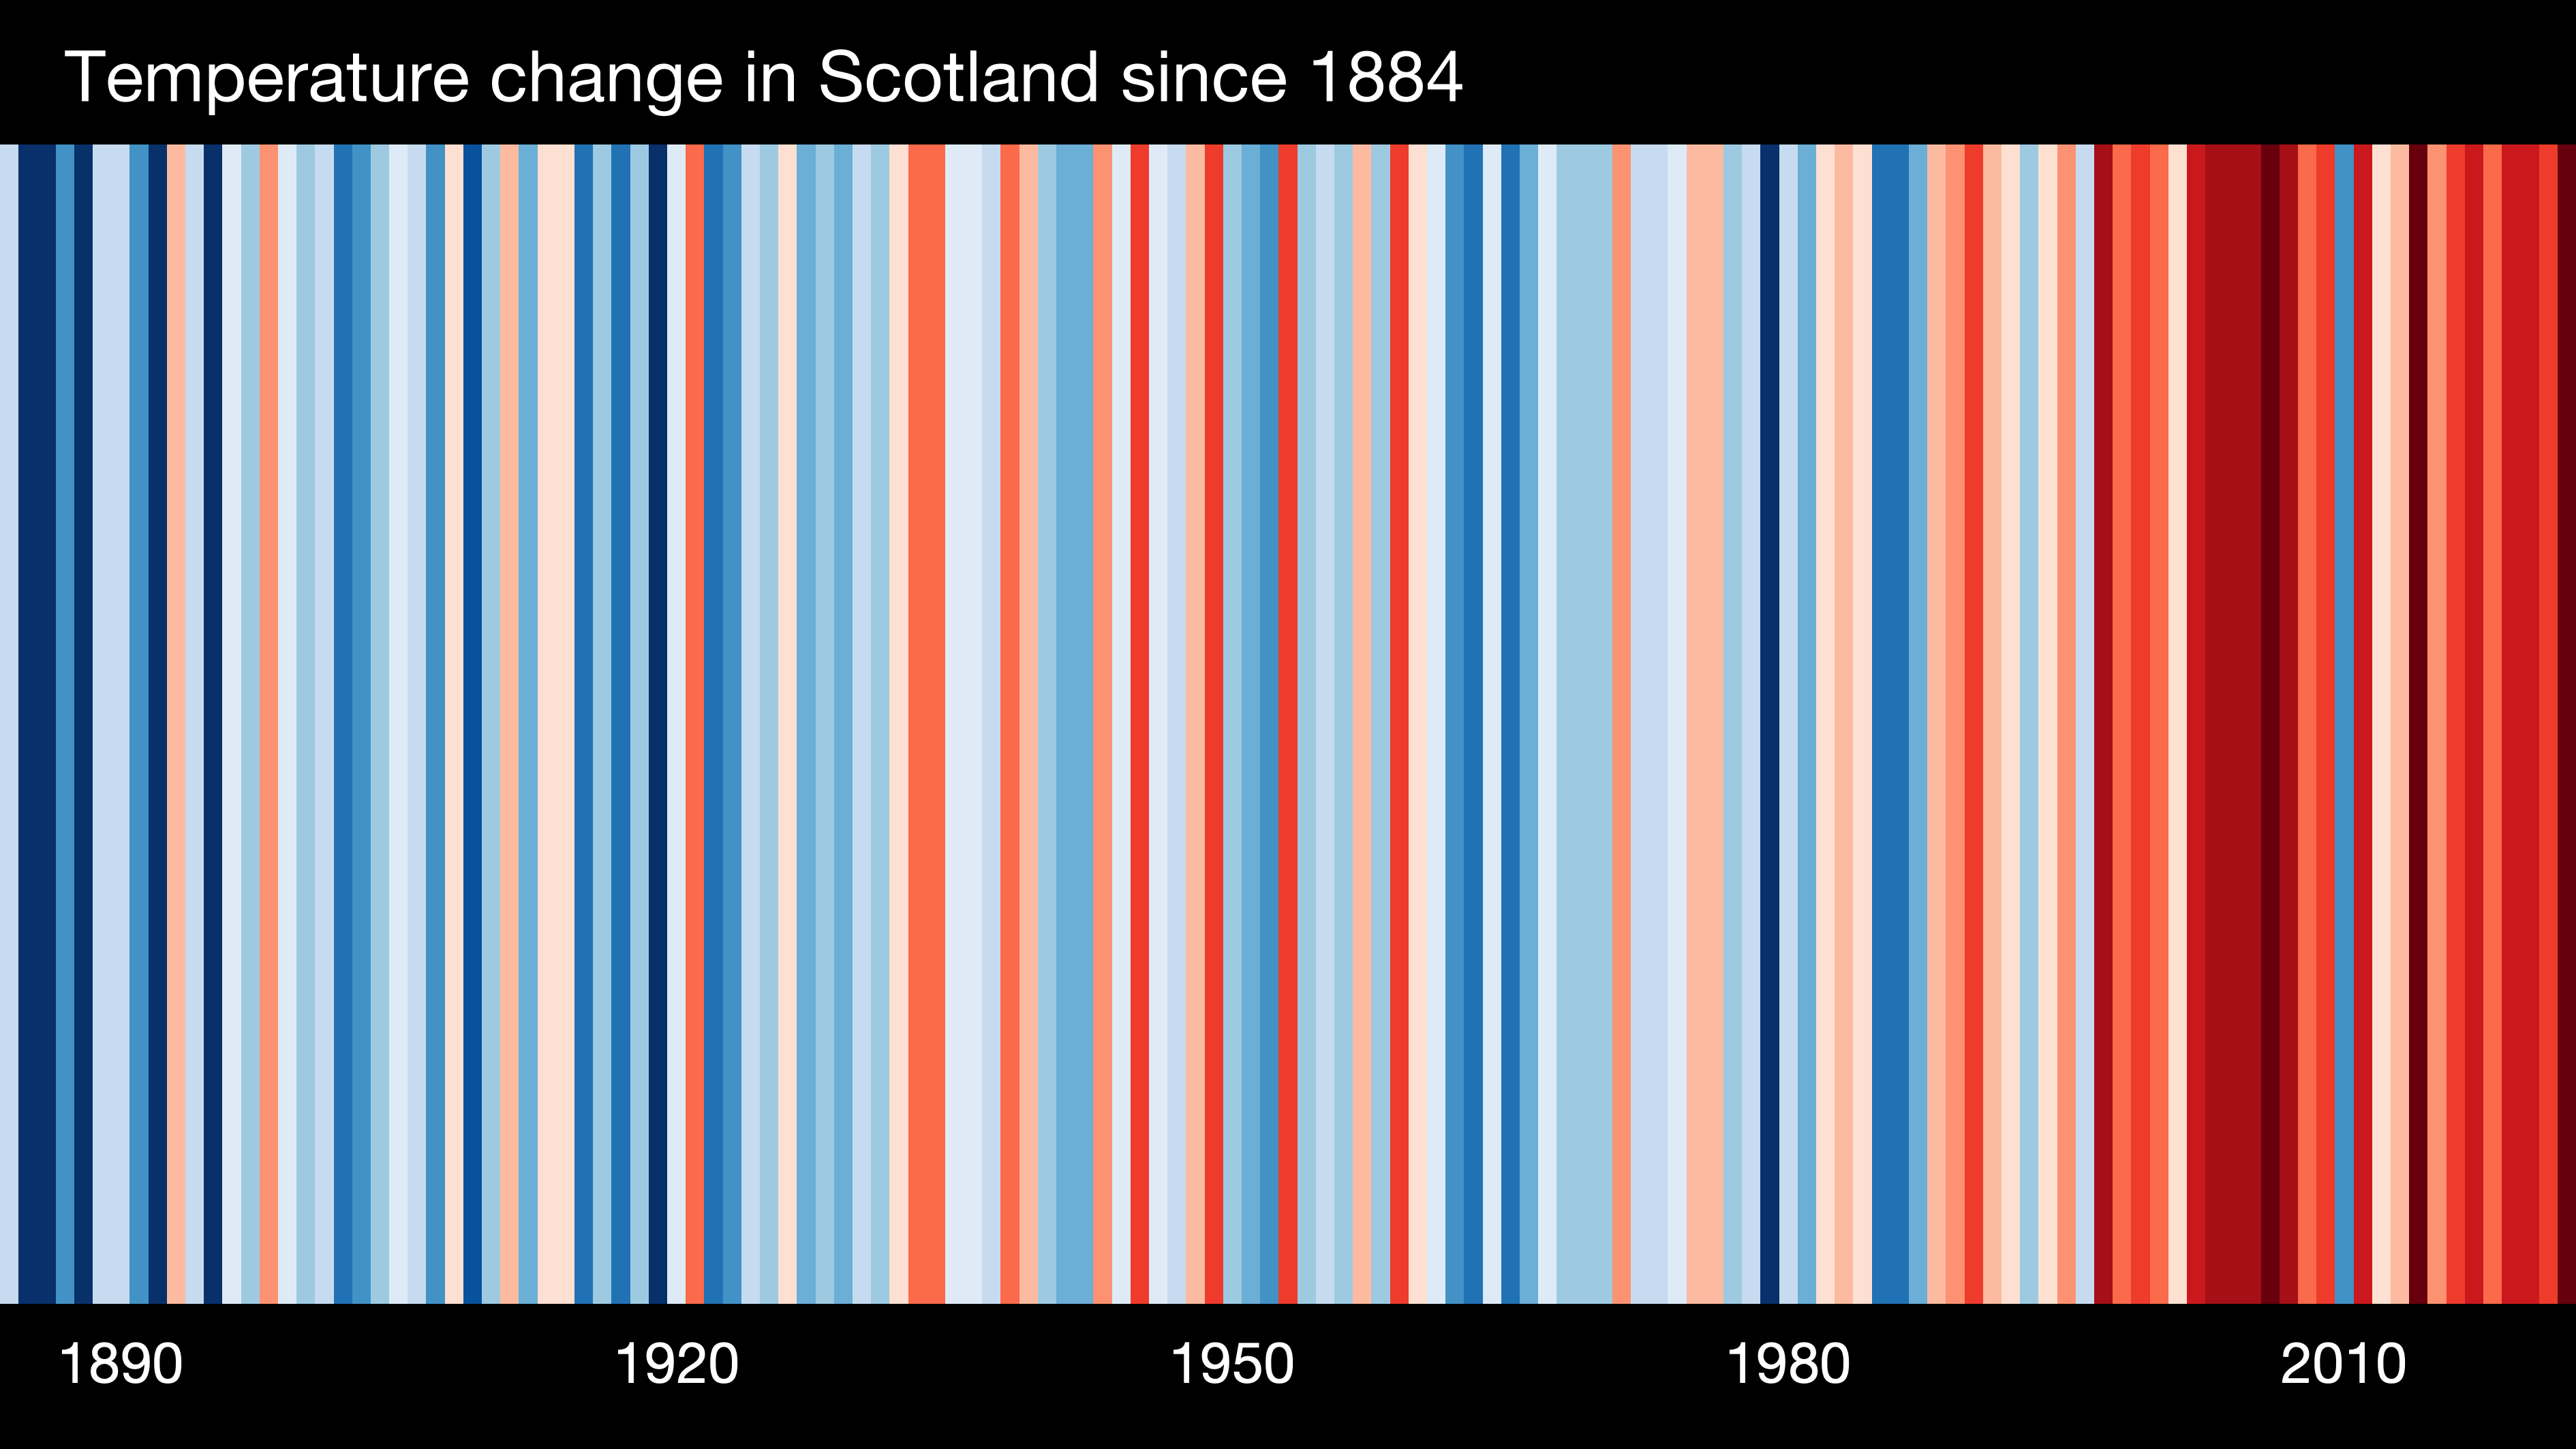
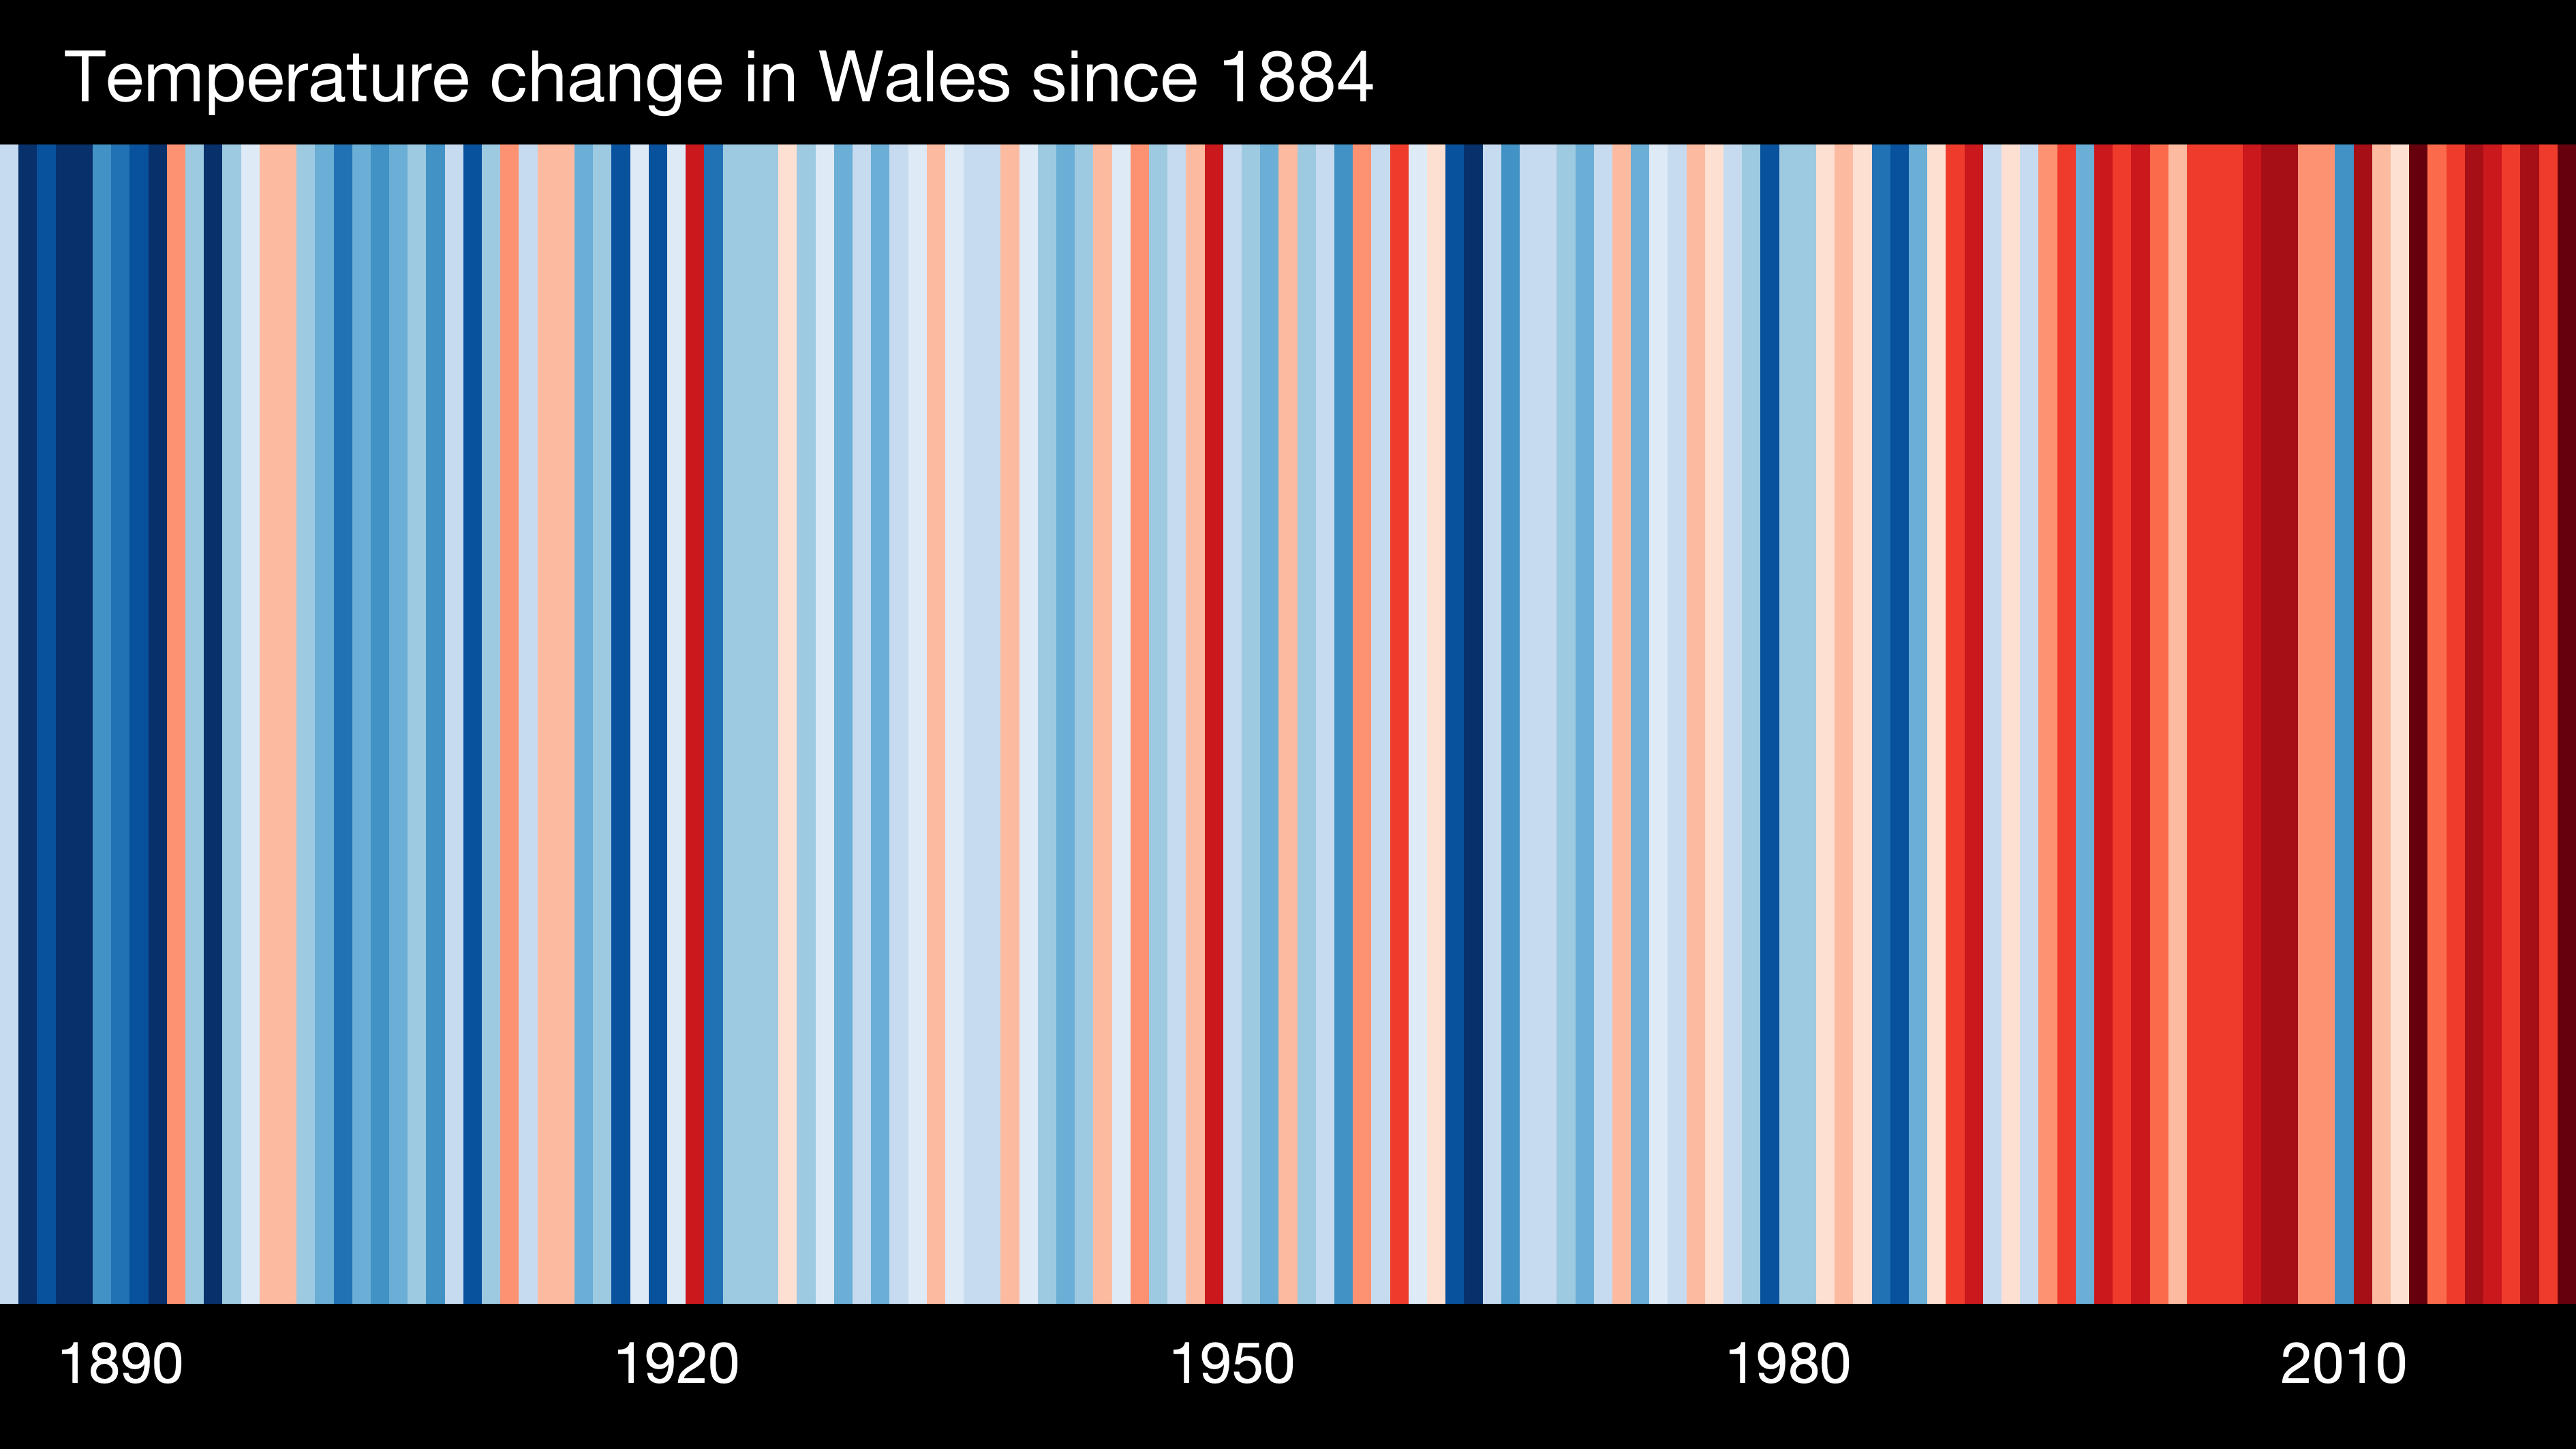
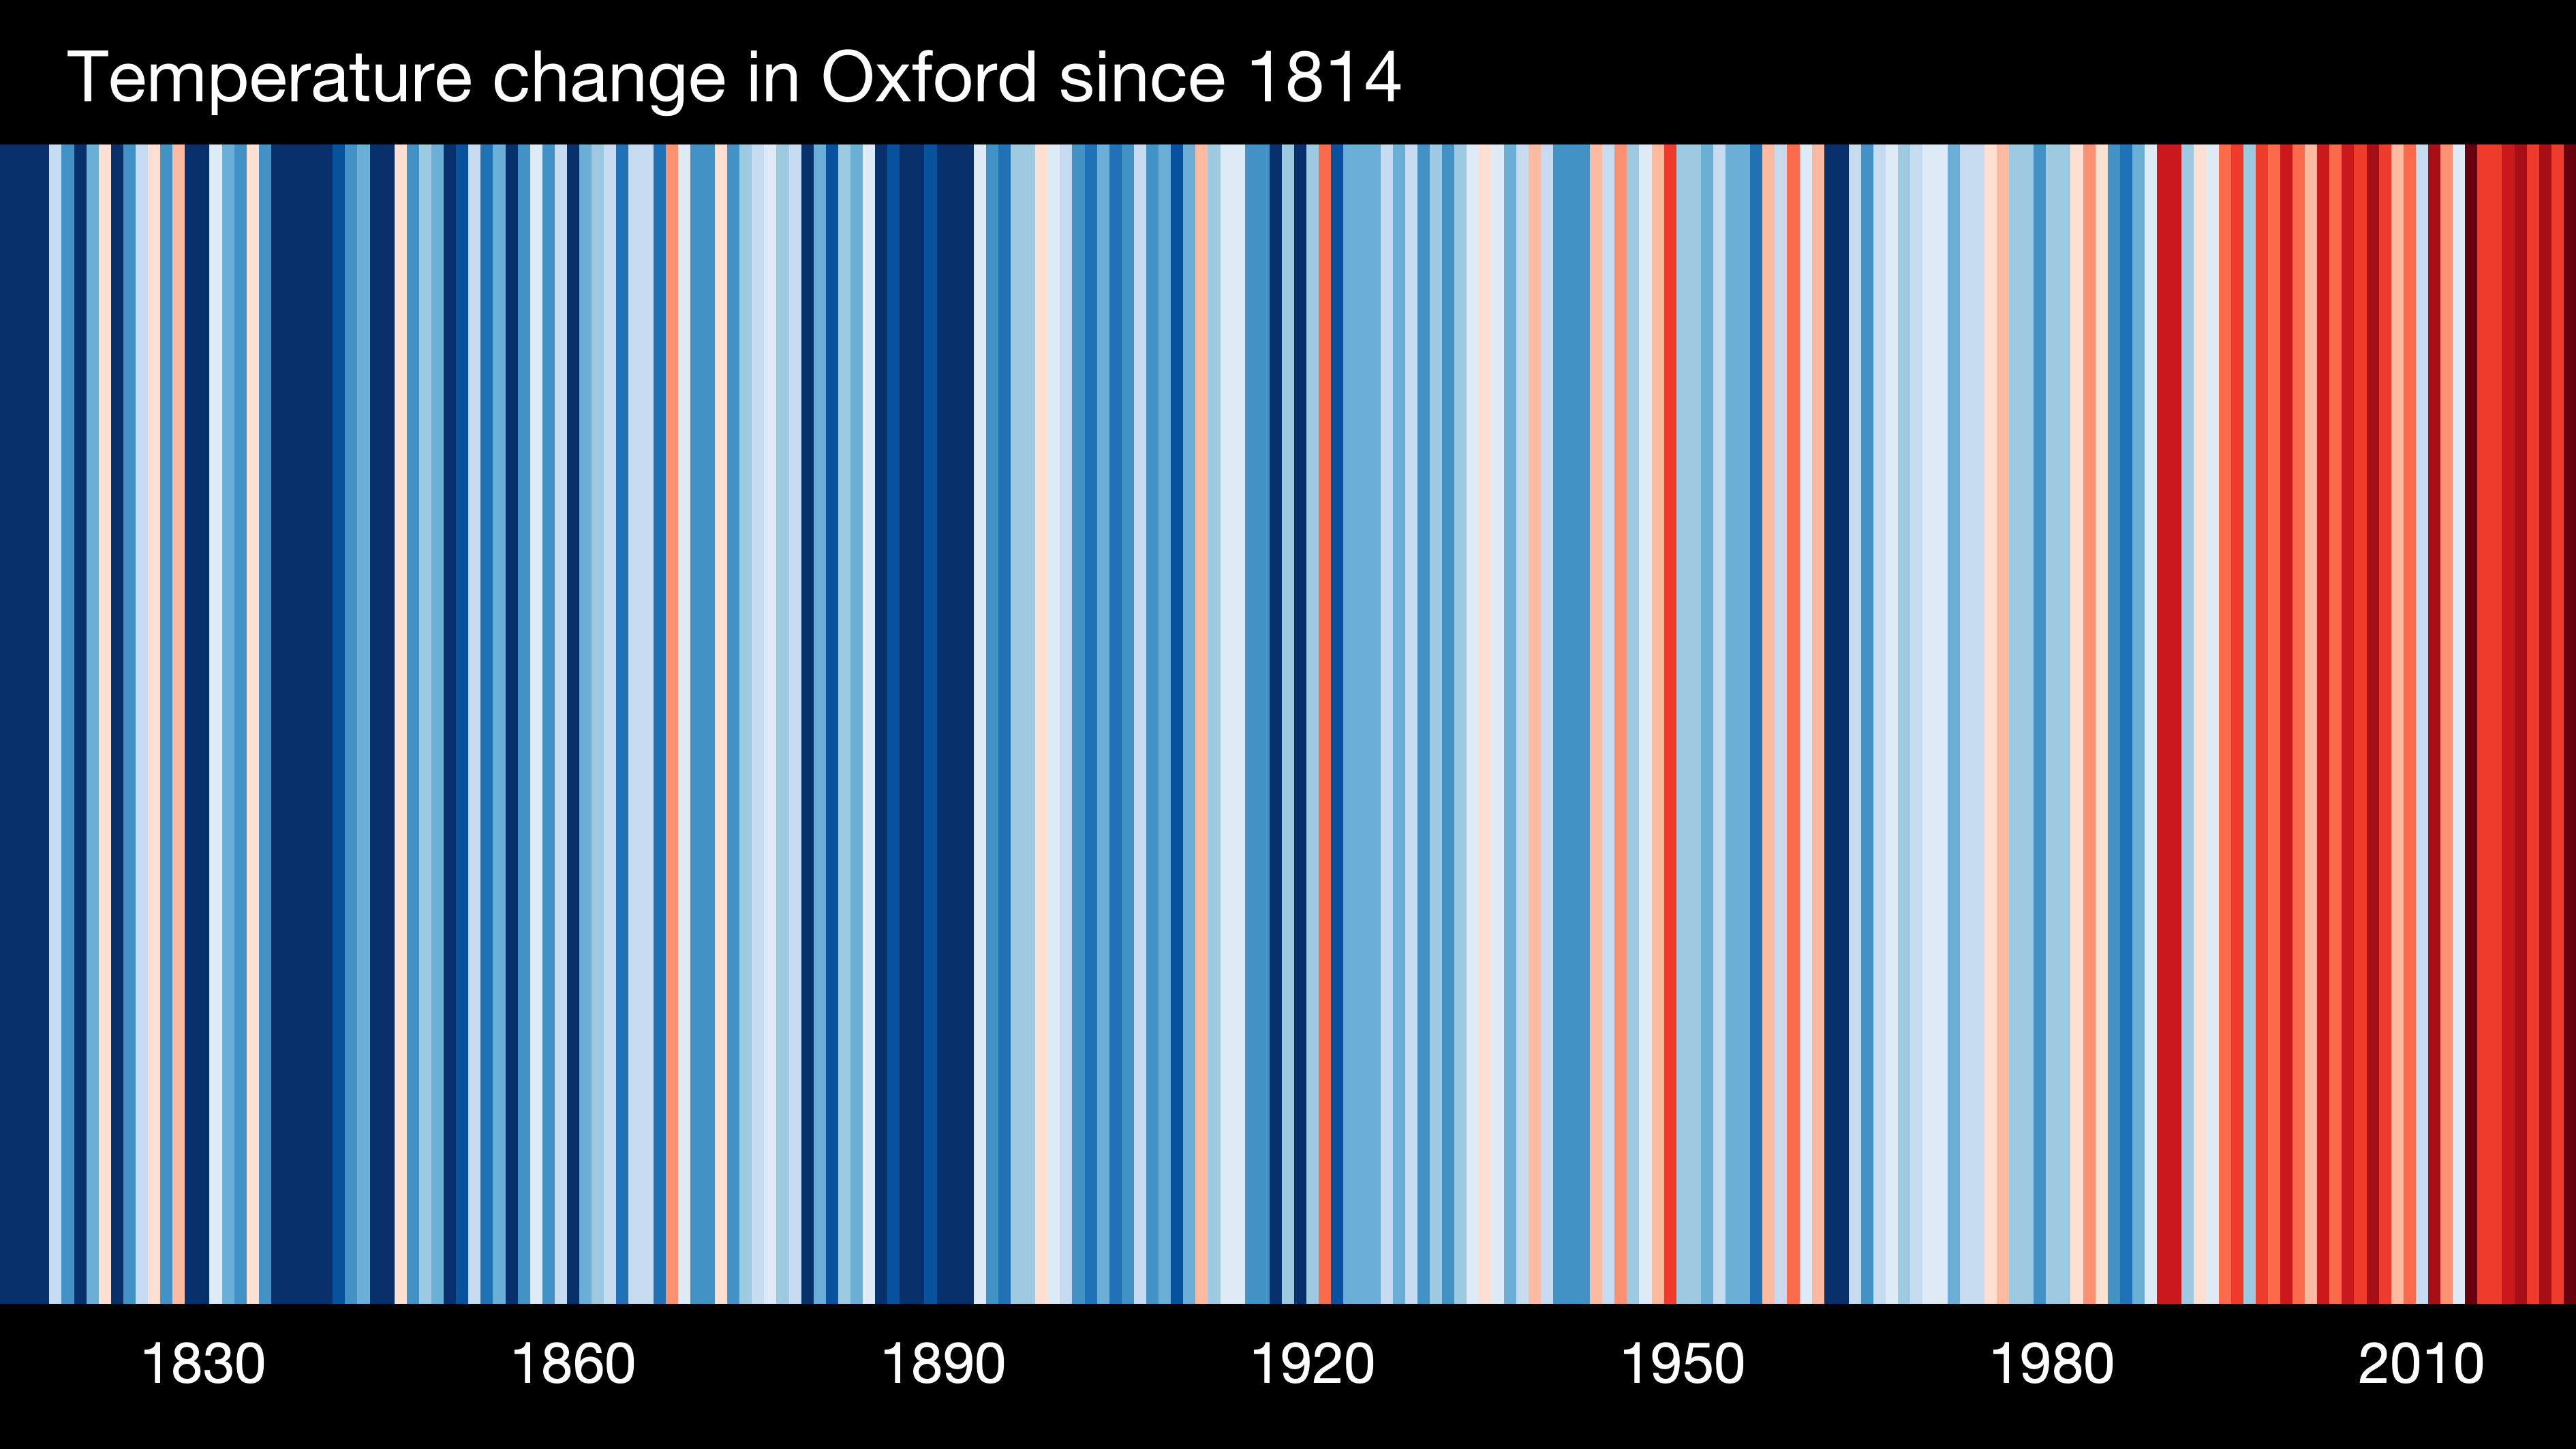
Warming stripes (sometimes referred to as climate stripes, climate timelines or stripe graphics) are data visualization graphics that use a series of coloured stripes chronologically ordered to visually portray long-term temperature trends. Warming stripes reflect a "minimalist" style, conceived to use colour alone to intuitively convey global warming trends to non-scientists while avoiding technical distractions.
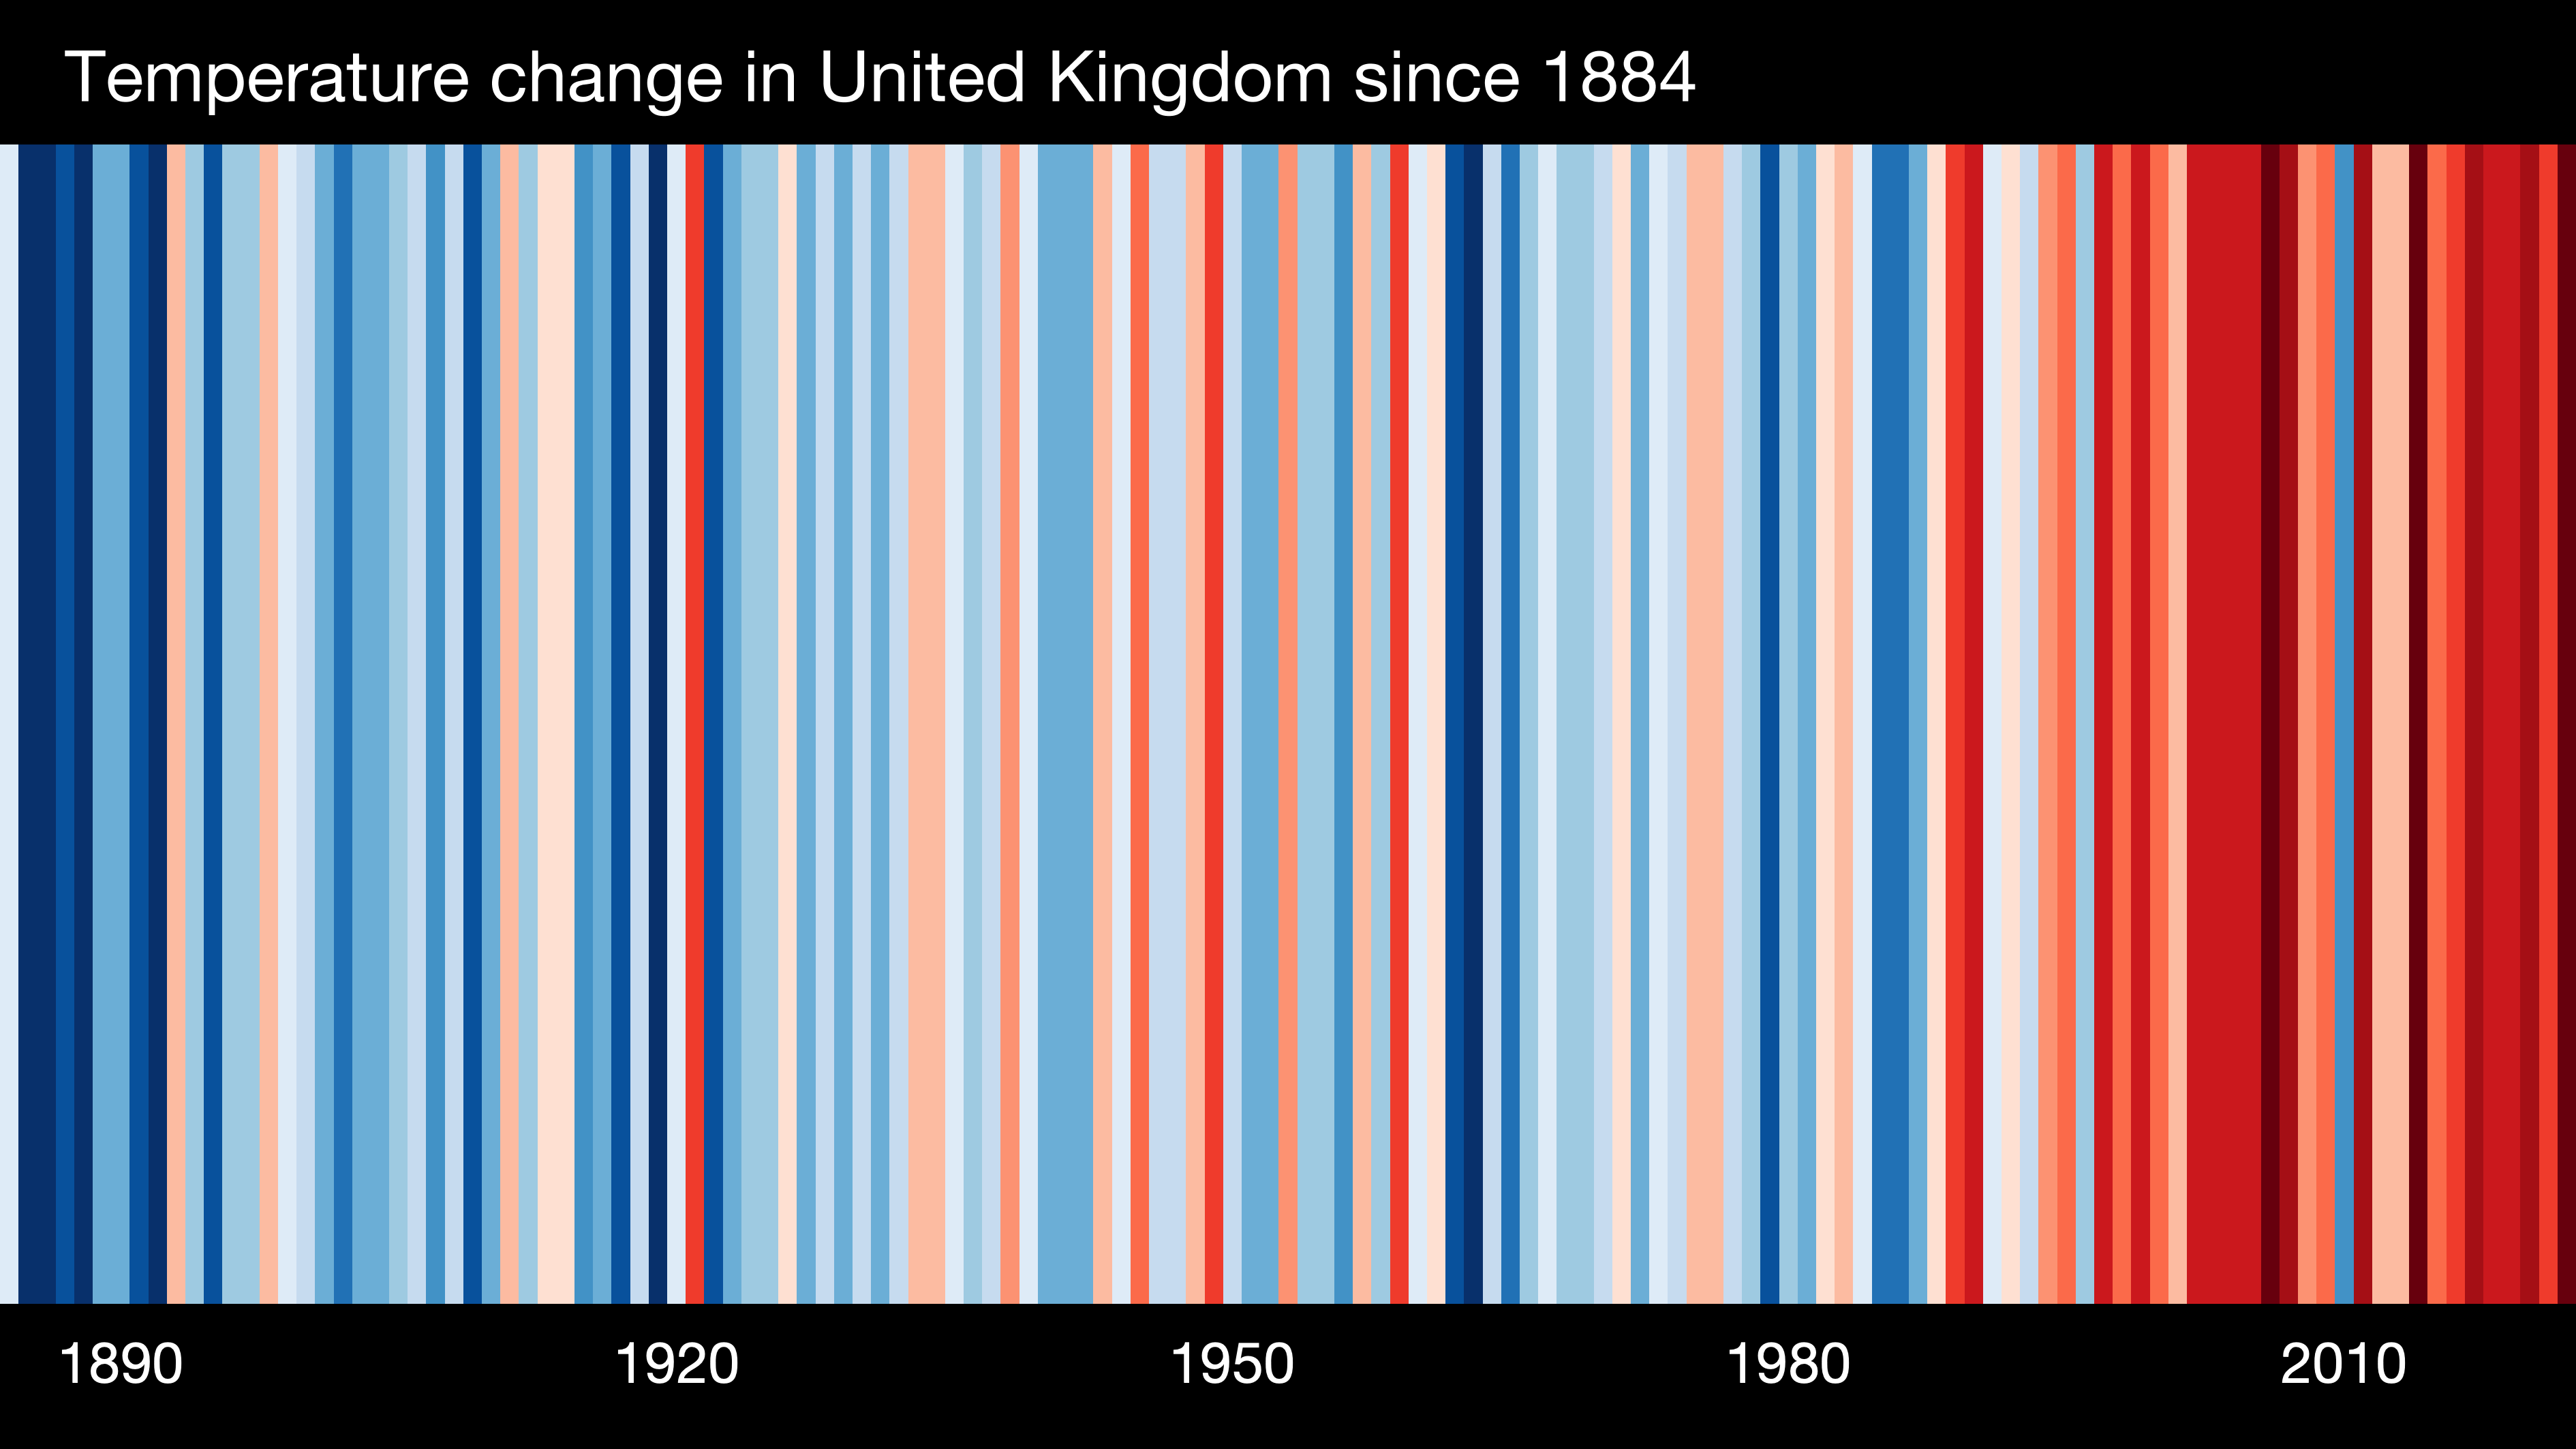
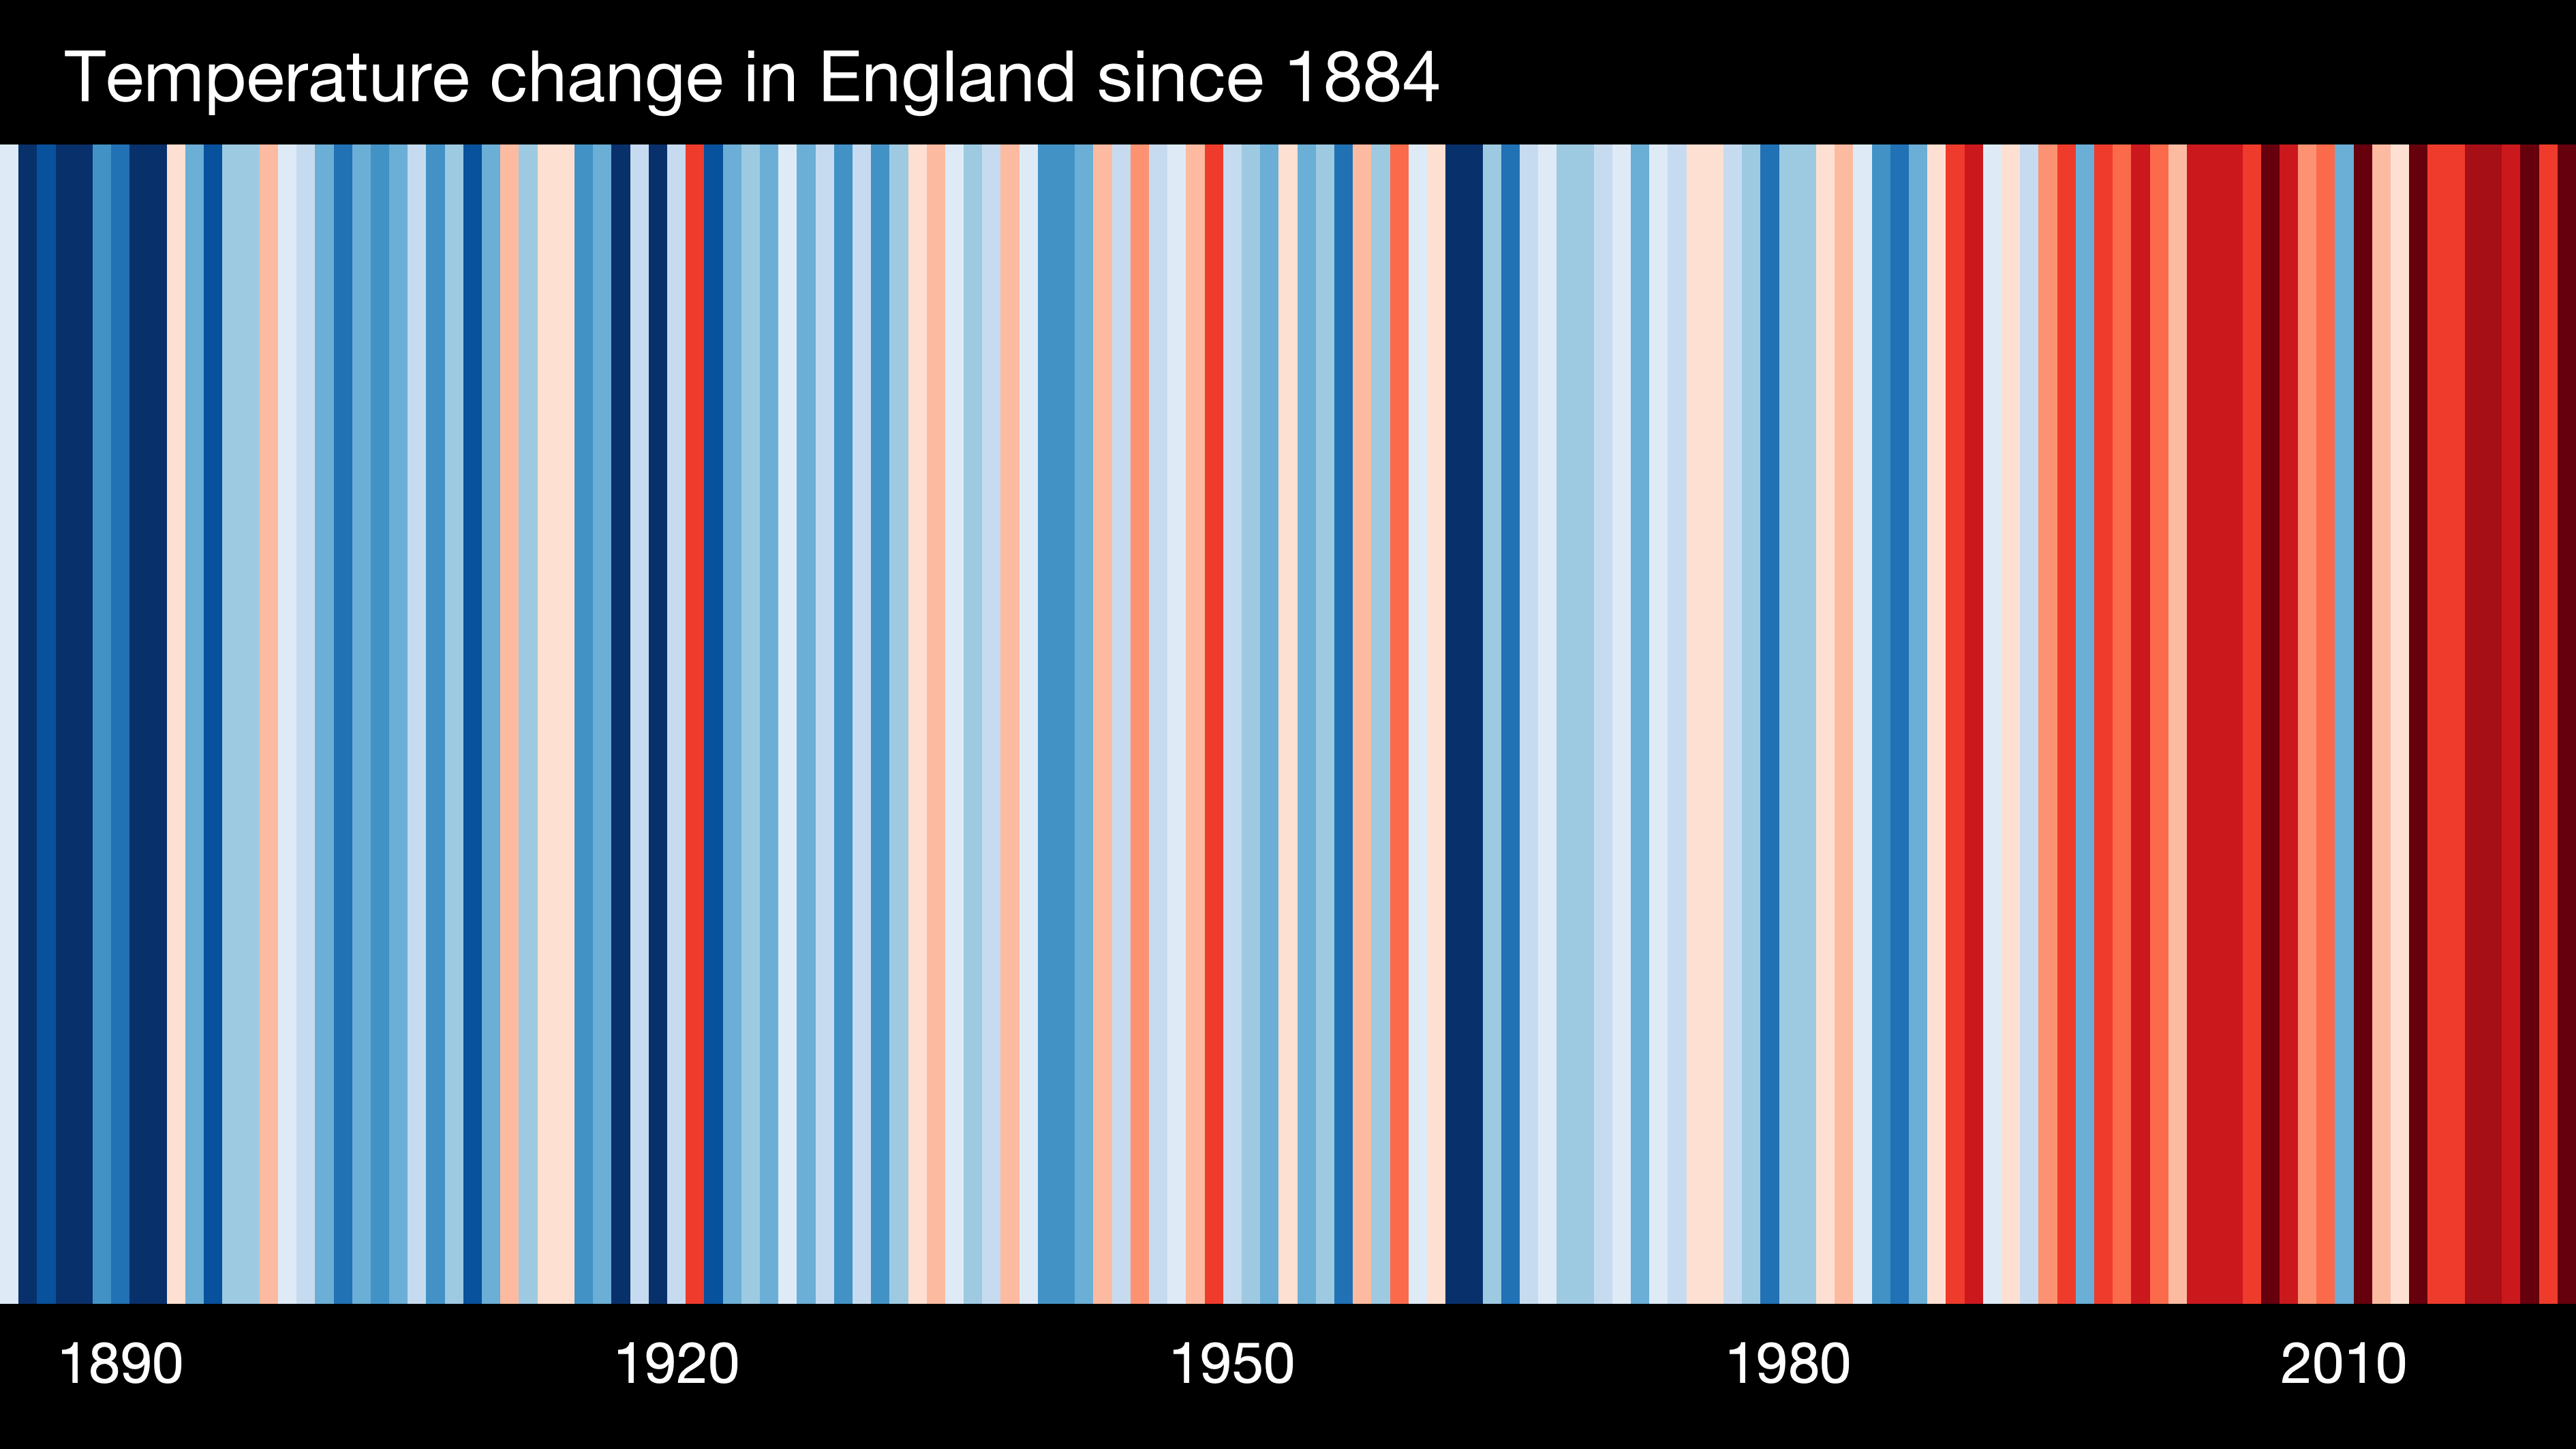
These warming stripe graphics are visual representations of the change in temperature as measured in each country over the past 100+ years. Each stripe represents the temperature in that country averaged over a year. For most countries, the stripes start in the year 1901 and finish in 2018. For the UK, USA, Switzerland & Germany, the data starts in the late 19th century.
To check out other countries see Showyourstripes
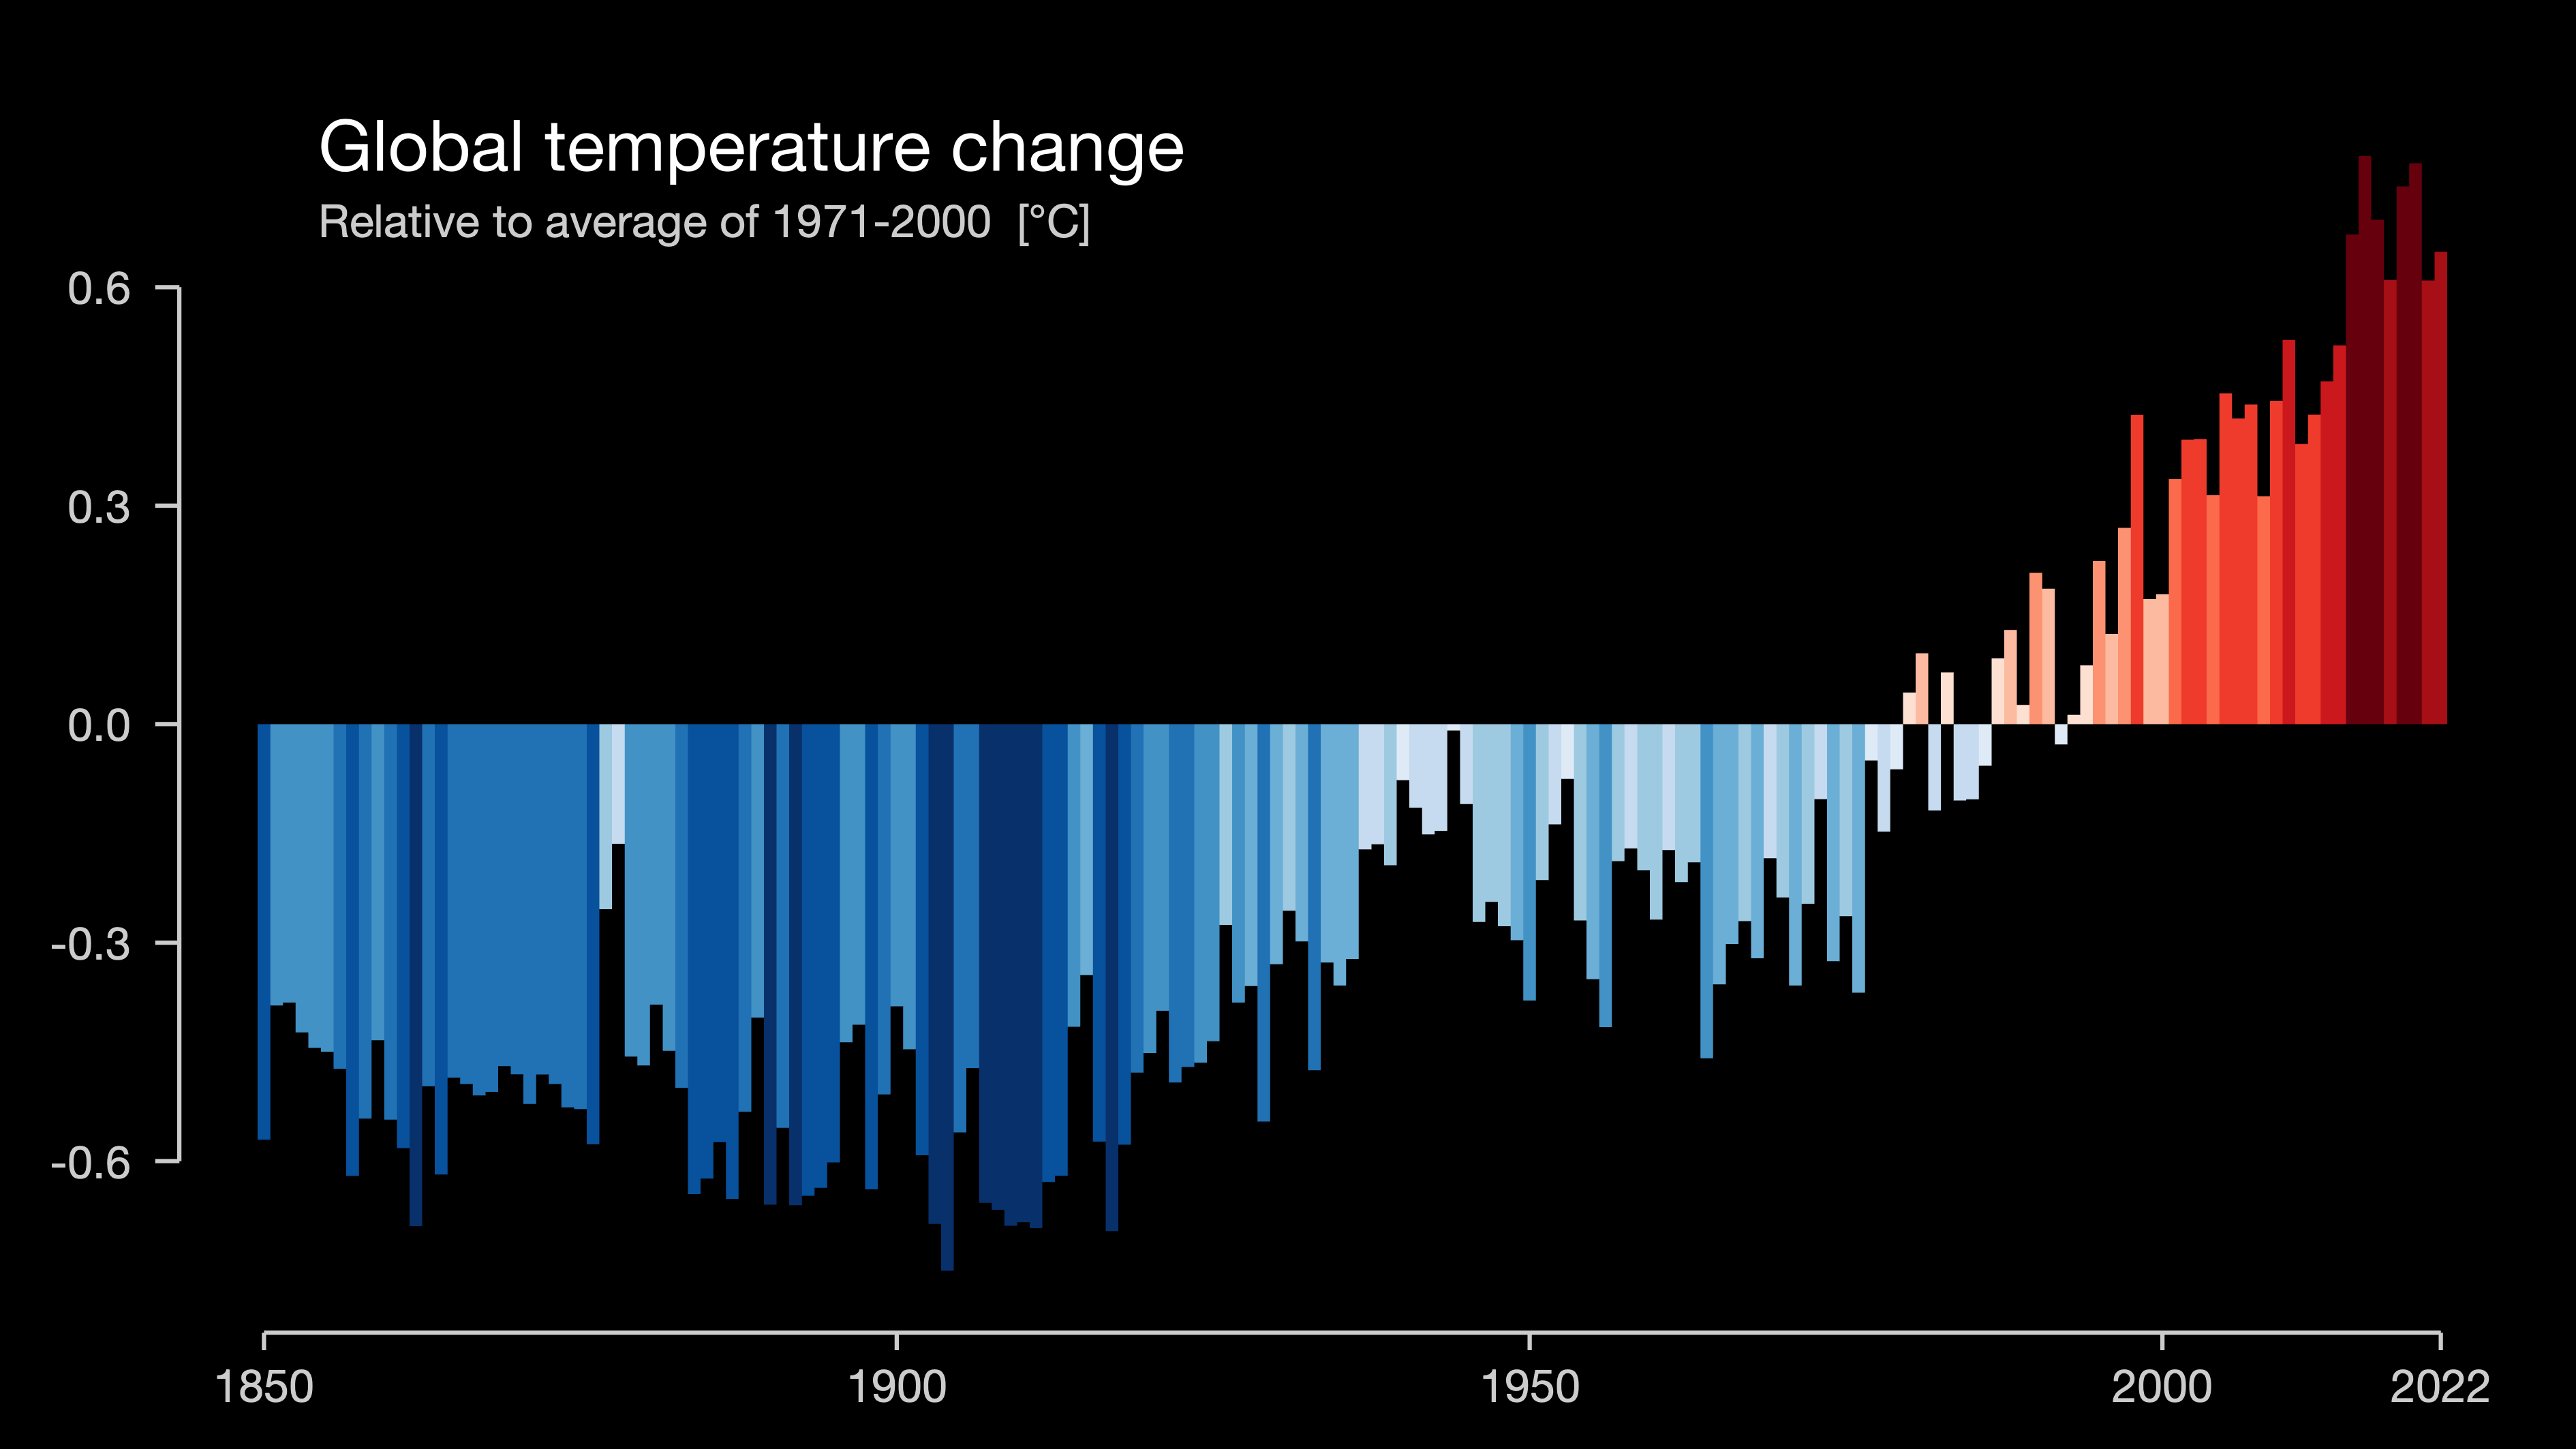
GLOBE from 1850-2022
GLOBE from 1850-2022 Bar Chart
United Kingdom from 1884-2022
England from 1884-2022
Northern Ireland from 1884-2022
Scotland from 1884-2022
Wales from 1884-2022
Oxford from 1814-2022
Data Courtesy of Professor Ed Hawkins (University of Reading) Showyourstripes
Page Updated 9th May 2023


 Feed
Feed Scan with QR Code Reader
 mobi
mobi


