


 Feed
Feed Scan with QR Code Reader
 mobi
mobi- Advertise / Donate
Welcome !
Newquay weather receives over 1000 vistors per day winter time, rising to over 3000 to 4000 or more in the summer, including visitors from all over the world.
Please help support this site

Your business

Via Paypal
- Accommodation
Hotels, B&B's and Caravan and Camping Sites

Porth Sands - Luxury beach accommodation wth beach facing balconies, a golden sandy beach making it the perfect place to idle away the hours- swimming, body boarding, sunbathing and paddling.
- Food
Restaurants, Cafe's, Takeaways

Pachanga - Pachanga Authentic Mexican Since 2016 we've been re-creating dishes that are part of our cultural heritage using techniques that are unique to Mexico. We use mostly Mexican, local & organic produce in our dishes & drinks
- Charity Events
Charity Events - Max 3 free ads
For a Free Charity Ad Here, please contact me- - Houses for Sale
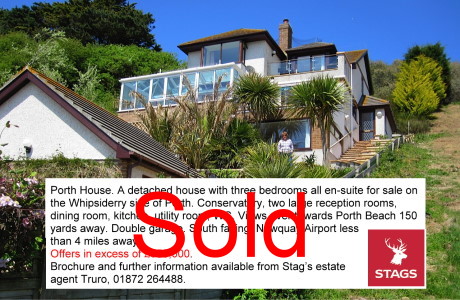
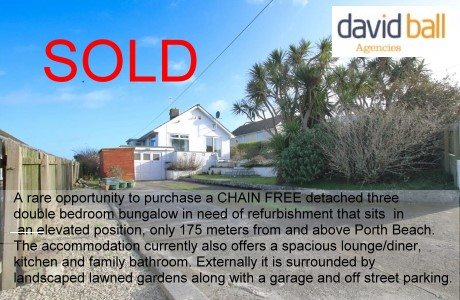
Houses for Sale
Advertise your house for sale here and help support this site.
Small photo, text + link to agents for a One off ₤25. Please contact me.Advertise your house for sale here
- Local Services
Shops, Services etc
Body BounceBody Bounce bouncy castle park in Newquay. Great fun, fantastically priced and we are open during the warmer months weather depending. (Postcode for SATNAV: TR7 2QF). Body Bounce also provides private bouncy castle hire. Check out our full range at Body-Bounce
Solar radiation and photovoltaic electricity potential - UK, Europe and the World
Irradiance [W/m2]: The intensity of solar radiation hitting a surface, which is the sum of the contributions of all wavelengths within the spectrum, expressed in units of Watts per m2 of a surface.

Irradiation map from PVGIS
Europe

Horizontal irradiation map from SolarGIS
World

© METEOTEST; based on www.meteonorm.com
